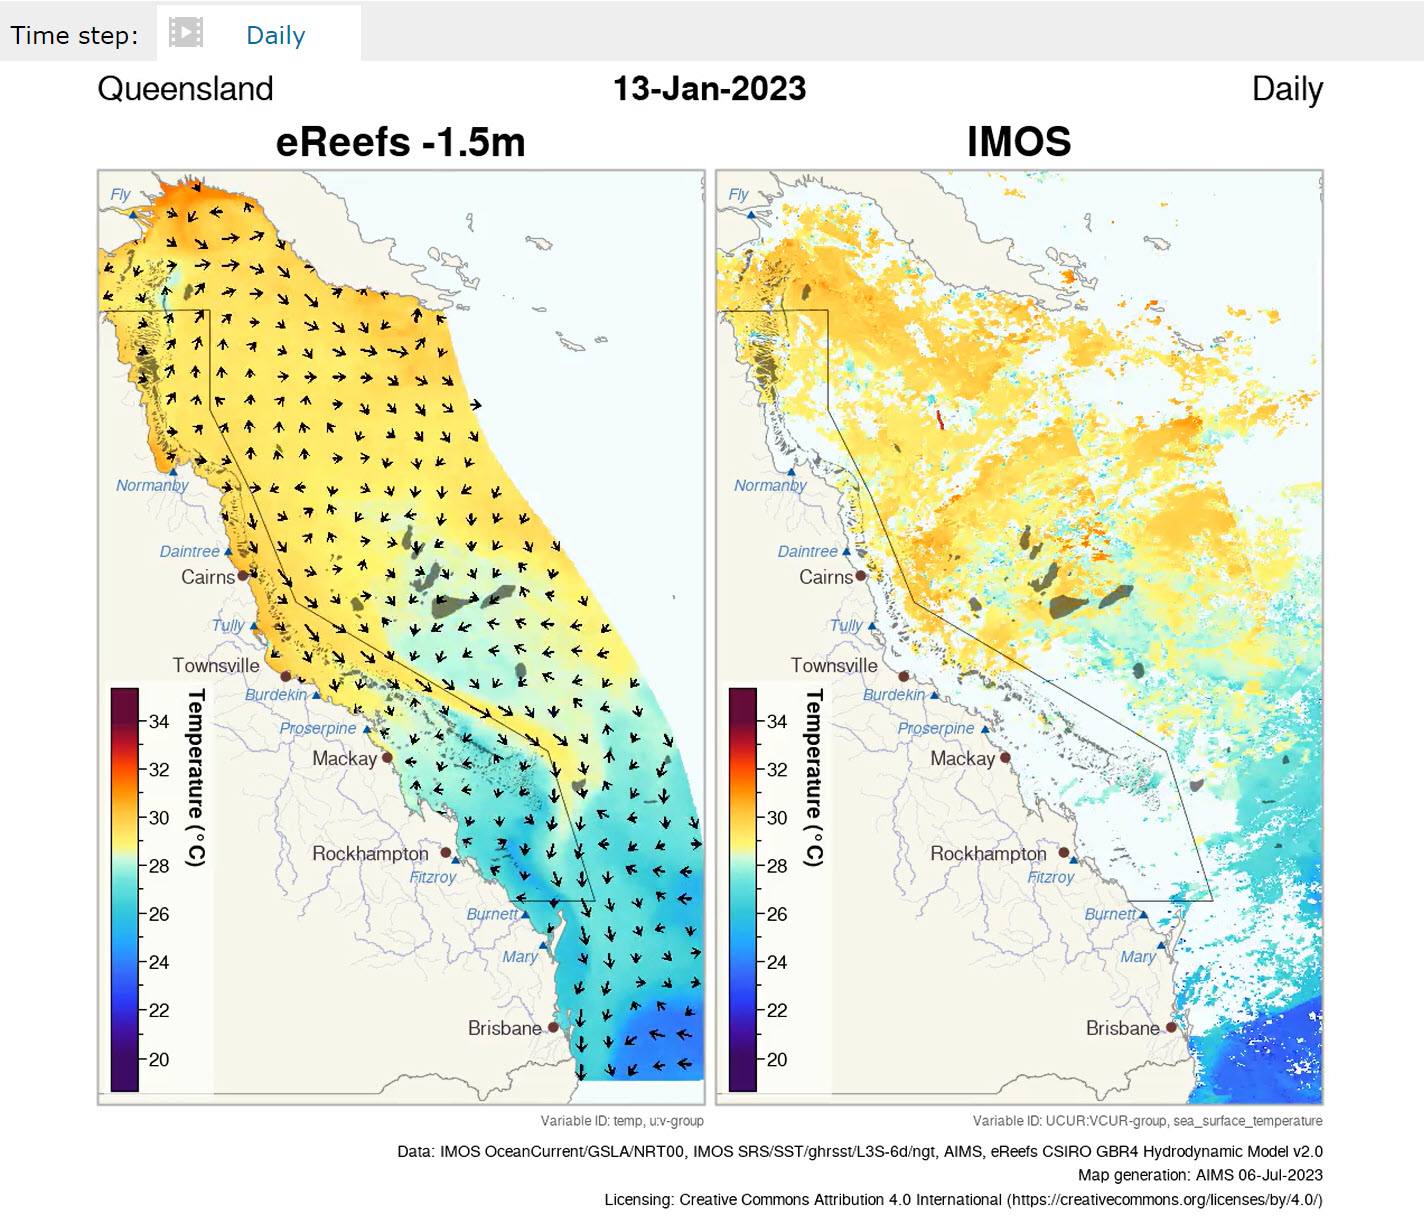
This section links to AIMS eReefs comparison product for the latest temperature and ocean current estimates from remote sensing (Ocean current IMOS) and the hydrodynamic CSIRO eReefs model. Each of these products have their own websites where more detailed views can be found.
Anomalies
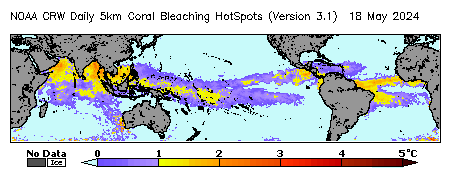
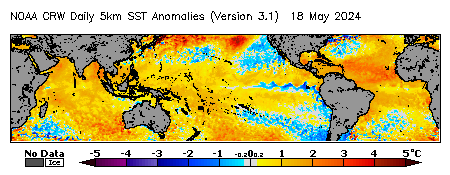
These products show the anomaly between the current temperature and the historic average temperature for the same period of the year (climatology). This allows us to see where it is warmer or cooler than normal. Areas that are significantly warmer than usual, particularly in summer, are likely to be feeling heat stress. If it remains significantly warmer than usual (positive anomalies) over several weeks then corals may start to bleach. The anomaly maps show the current level of heat stress, where as the Accumulation products (see below) keep track of the total heat stress over the summer period.
OceanCurrent
NOAA Heat Stress Monitoring
Accumulation
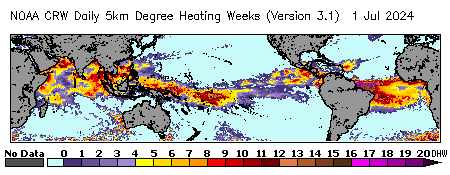
This section covers products that measure the accumulation of heat stress over time. Coral reefs bleach when they are exposed to temperatures above their natural tolerance limit. The greater the temperature above this limit the faster the bleaching will occur. This heat stress in coral is most often measured using a metric of Degree Heating Weeks (DHW), which is typically calculated from the number of degrees Celsius that the water is above the average historic hottest month's (typically March) temperature. This temperature difference is then accumulated over time. So 2 degrees above the average temperature of the hottest month for 3 weeks would be 6 DHW.
Corals typically start to bleach after 2 DHW and significant mortality after 6 DHW (Terry Hughes et. al.)
The ReefTemp Next Generation product uses Degree Heating Days (DHD). This is similar to DHW but over days instead. Our previous example of +2 degrees anomaly over 3 weeks would be 2 (deg) x 3 (wk) x 7 (days/wk) = 42 DHD.
OceanCurrent
NOAA Heat Stress Monitoring
eReefs
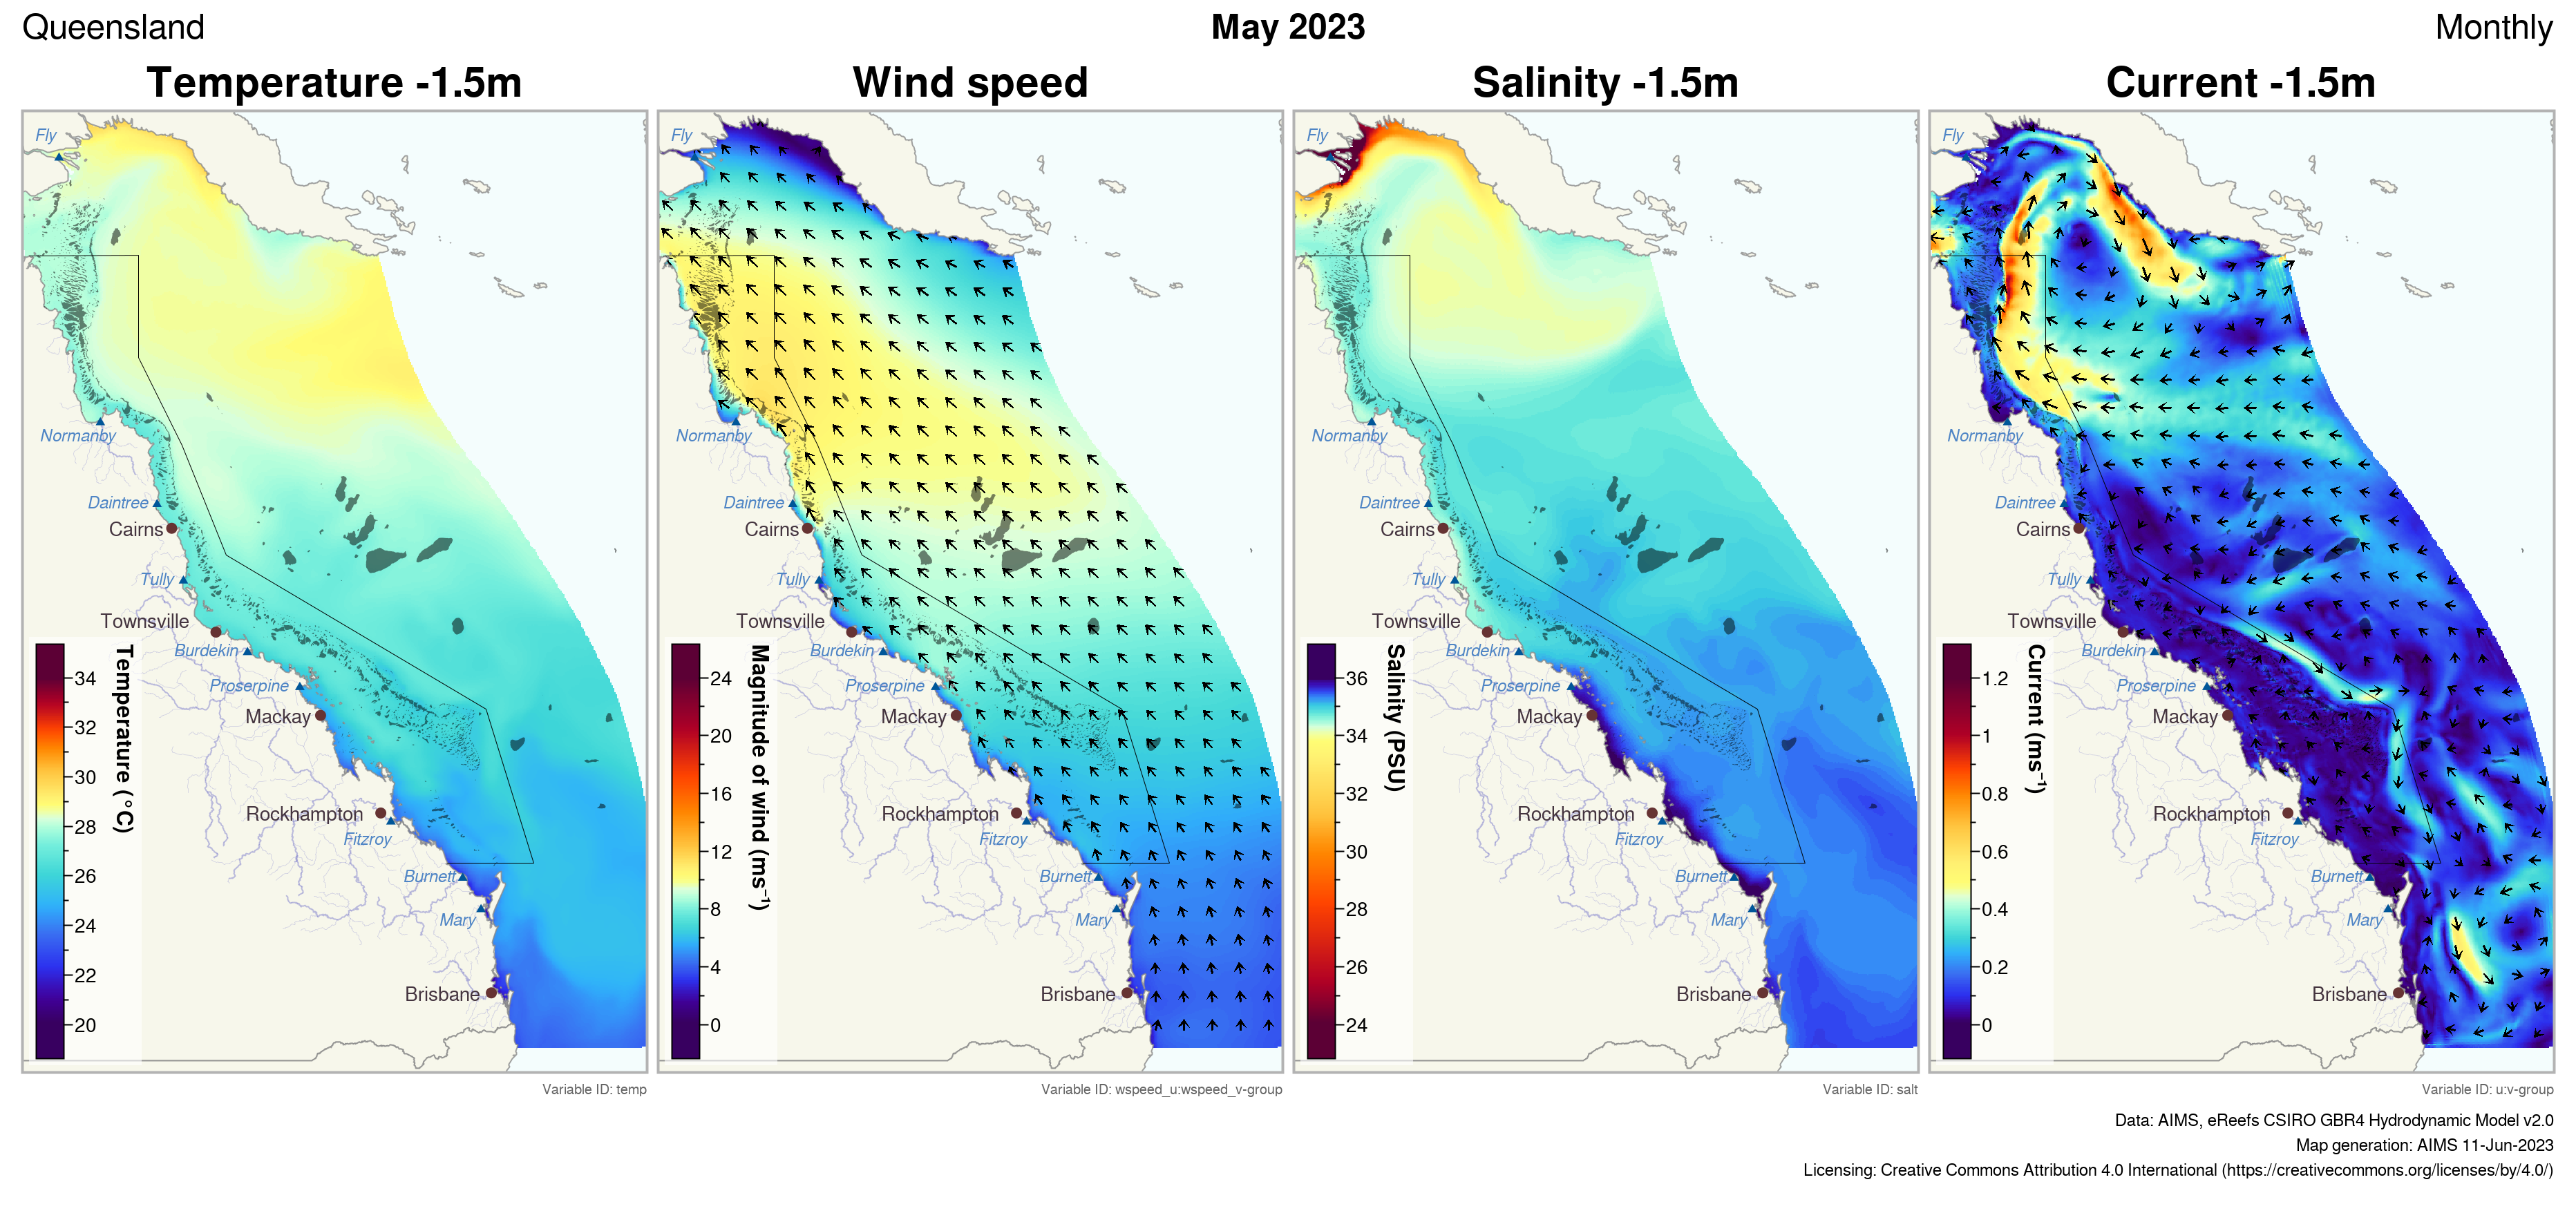
eReefs is a hydrodynamic model, run by CSIRO, of the waters of the GBR driven from near real time weather models (from BOM) and river run off from (BOM and Queensland Government). It provides near real time updates on the water temperature. It has the advantage of not being affected by clouds as satellite derived estimates of temperature are, and it models the ocean in three dimensions, allowing the depth penetration of marine heat waves to be estimated. eReefs has a back catalogue of model results from 2011 onwards.
- Temperature, wind, salinty and current (GBR4) - Shows the temperature, along with key drivers of the dynamics of the water. This is a 4 km resolution model that provides coverage of the GBR and Coral Sea.
- Temperature, wind, salinity and current (GBR1) - This shows the same comparison by at 1 km resolution. This only provides coverage of the GBR.
- Temperature at 1.5m, 18m and 49m depth (GBR4) - Temperature at a range of depths (4 km model, GBR and Coral Sea)
- Temperature at 2.35m, 18m and 49m depth (GBR1) - Temperature at a range of depths (1 km model, GBR)
AIMS
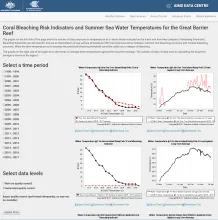
Great Barrier Reef Coral Bleaching Predictions and Coral Reef Temperatures This site compares the AIMS weather station measurements with known bleaching profiles. It shows graphs of the current temperate along side the historic average.
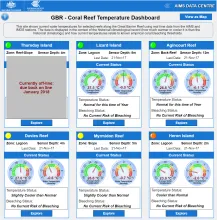
GBR - Coral Reef Temperature Dashboard This site compares the temperature measurements from the AIMS weather stations with bleaching conditions, showing the temperature anomaly.
Observations
AIMS
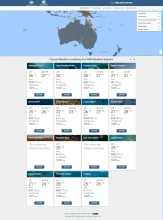
AIMS Weather Stations These weather stations are positioned along the coast and give real-time measurements of the atmospheric and ocean conditions.
ANFOG Glider Fleet
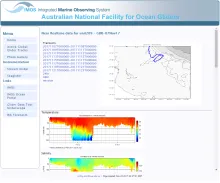
ANFOG Slocum Glider These instruments provide in-situ measurements of the water column showing from the surface to close to the sea floor. This allows us to verify how deep warm water conditions exist. Each glider deployment can travel for several weeks.
Seasonal Forecasts
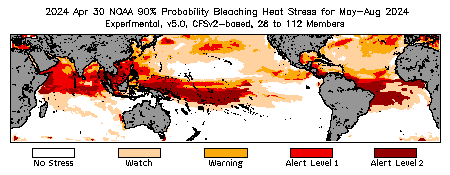
NOAA Seasonal Coral Bleaching Heat Stress Outlook