This article outlines the use of two R packages, geoMap and geo, developed to analyse data and generate outputs for the e-atlas and ningaloo-atlas. geoMap generates a variety of plots that can be used for exploratory analysis, presentations and publication-quality maps. geo is an extensive set of spatial modelling techniques that produces fitted surfaces that can be added to publication graphics, or added to the e-atlas as layers, or used as KMLs.
R is an extremely powerful statistical and graphical package, but it is not easy to learn and is less easy to use effeciently and effectively. This project aims to simplify and make robust the processes of using R for spatial modelling and and the generation of complex graphics. The guide discusses data management and the partial-automation of some of these processes.
If you are interested in using geoMap and/or geo then check out the two attached PDF documents first.
geoMap
The package geoMap can produce a great variety of plots that can be used for both exploratory analysis, presentations and publication. The types of displays include:
- Simple black and white line maps with no frills.
- More complex colour-rich mappings with additional shapes, features and labels
- Additional interactive data exploration and displays
- Production of publication quality graphics with no editing needed!
- Composite maps with several images on a single page
- Rotation of maps; useful to more efficiently map the GBR
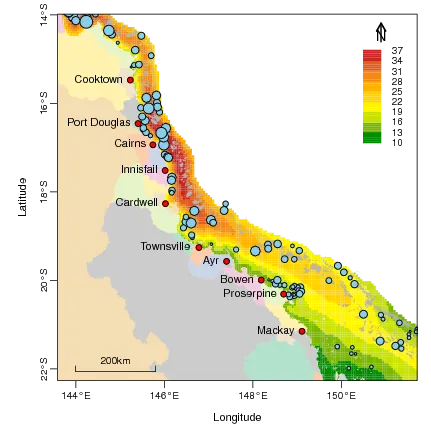
Fig 1
showing data points, towns, catchments and a fitted surface from geoFit
geo
Modelling with the geo package involves four steps: (1) data preparation, (2) grid generation, (3) spatial anlysis, and (4) outputs.
Spatial models include generalized additive models (GAMs) with the degree of smoothness typically selected by generalized cross-validation. GAMs can model data with non-normally distributed errors, e.g. binomial and poisson data. Other models such as boosted trees and non-parametric smoothers are also available, and include robust methods.
The models are assessed by examining residual plots and spatial correlation, and the predicted grids can be enhanced by trimming. This is based on comparison of variation of predictions at the sampling sites with predictions on the spatial grid.
The following outputs can be generated:
(a) KML files that can be viewed in Google Earth
(b) Grided predictions and various graphical elements and styles (e.g. colour schemes) that are
used in the mapping tools of the e-Atlas and ningaloo-Atlas
(c) Publication quality maps of the fitted surfaces and geographical elements
Attachments
- Documentatlas-mapmaker.pdf (3.94 MB)
- Documentatlas-rtools-guide.pdf (9.06 MB)
- Documentr-geo-packages-win-binaries.zip (15.91 MB)
- Documentr-geo-packages-source.zip (17.69 MB)
- Documentsoft_corals_reef-richness-2.kmz (181.75 KB)
- Documentsoft_corals_reef-richness-g.kmz (197.03 KB)
- Documentsoft_corals_reef-richness_zooxanthellate-v.kmz (321.18 KB)