Over the last fifteen years a number of major efforts have significantly expanded the sustained monitoring of the Great Barrier Reef (GBR). The Australian Institute of Marine Science's (AIMS) on-reef weather stations were initiated in the 1980s, however the Great Barrier Reef Marine Park Authoritiy’s (GBRMPA) Marine and AIMS Long-Term Monitoring Programs have added loggers to their sites under the AIMS Sea Water Temperature Observing System over the last 2 and 3 decades (respectively). The Integrated Marine Observing System (IMOS) commenced in 2007 and has introduced a host of new platforms and technologies providing data that are all publicly available. With the growth in observations from multiple organisations there is not a clear summary of what is available.
These pages provide an entry point to the major publicly available temperature observations from physical oceanographic data collected on the Great Barrier Reef during the recent 2016 and 2017 mass coral bleaching events. The main impact emerging as a result of a warming tropical ocean is a thermal stress response of the benthic communities which has increased the spatial footprint of severe coral bleaching and mortality in the past 5 years. The work to perform this compilation and analysis was done as part of the NESP TWQ 4.2 Oceanographic drivers of bleaching in the GBR: from observations to prediction project.
The primary data set is temperature from over 100 permanent temperature logger locations within the reef from the AIMS temperature logger program and other platforms, which include both mobile gliders and drifting buoys to fixed weather stations, wave buoys and moorings. This comprehensive quality-controlled data set is to assist the delivery of the data to better characterise thermal stress events on the GBR to users.
Summary plots of the data can be interrogated and daily climatologies are provided so users can quickly determine the thermal history at each site. Other relevant data sets are provided from multiple observing platforms with a summary plot. Some data sets have well developed websites with data visualisations and so a link to those sites and data sources are also provided as the recommended location from which to access the data.
Beyond observations some key climatologies that have been applied in this project are presented - from SSTAARS a satellite SST derived climatology and from the in situ temperature loggers if there is a long enough record.
A more detailed description of these data collections can be found from Steinberg et al. (2021).
Temperature logger dashboards
The temperature logger dashboards provide a quick way to view and interact with the temperature logger data, and to compare the logger data for 2015 - 2017 against annual climatology. This collection includes data from the AIMS temperature logger program, AIMS weather stations, Queensland Government wave buoys and the IMOS Moorings. Each data type and primary source is described in the following sections.
This map shows temperature logger data sites. Zoom in to see the site names and which sites have data for the mass bleaching years.
NOTE: Click on a site to access its temperature dashboards.
The individual reefs can be accessed by zooming in on the map and clicking on the circles. Figure 2 shows the initial dashboard for Davies Reef with plots of the temperature observations from the reef flat and also the reef slope if the tab on the top left of the plot is clicked. A metadata summary, map and description of each of the reef locations is provided.
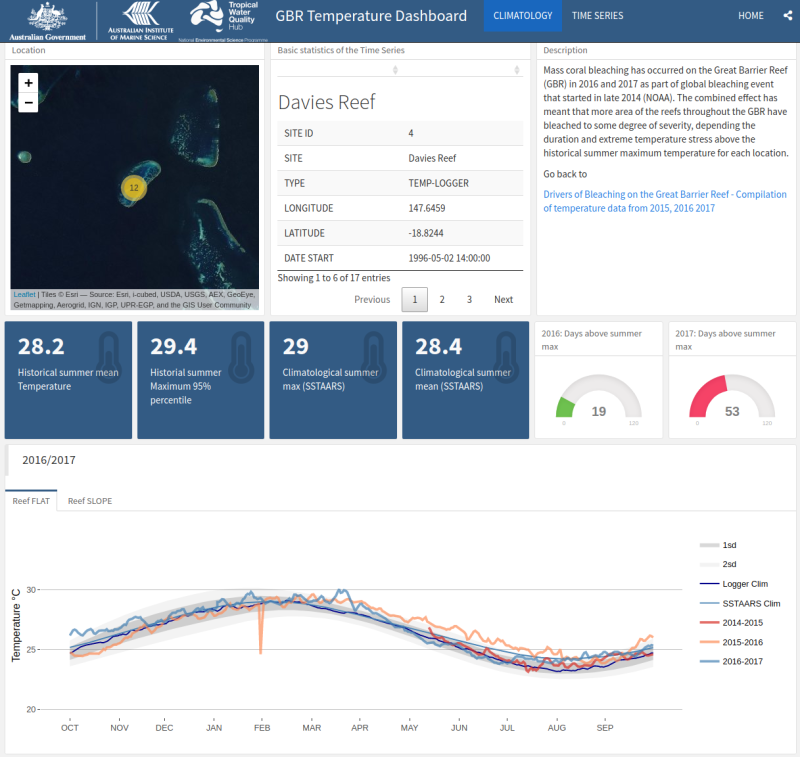
Figure 2: Example dashboard for Davies Reef temperature loggers 2014-15 (red),2015-16 (orange) and 2016-17 (blue) showing the timeseries plotted over the logger (dark blue) and SSTAARS (light blue) climatologies. Grey shaded areas show the 1st and 2nd standard deviations.
Clicking “TIME SERIES” on the banner at the top reveals the time series plots of both of the reef flat and slope sites (Figure 3). A slide bar at the bottom of each plot allows the full historical record to be viewed. In this case 1996 – 2017 can be seen. The window view can also be adjusted to see a subset of the record.
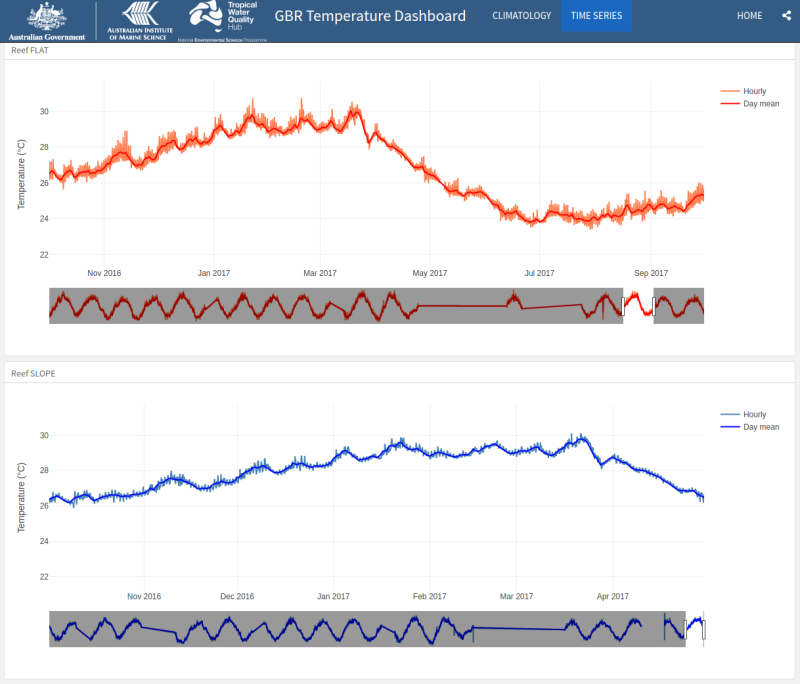
Figure 3: Example dashboard for Davies Reef temperature loggers 2015-17 showing the time series of each location: Reef FLAT (top) and Reef SLOPE (bottom).
AIMS Temperature logger program
Links to resources:
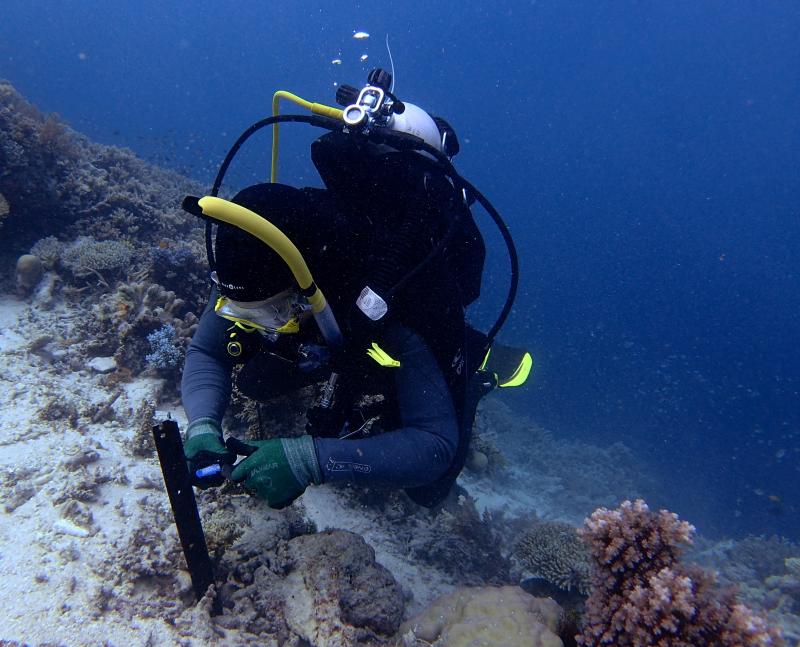
 Australian Institute of Marine Science, Taylor Simkins
Description
The AIMS Temperature logger program installs reliable temperature sensors at 2-3 depths and habitats on a representative number of reefs throughout the Great Barrier Reef for long-term in water records of ocean temperatures.
AIMS temperature loggers are deployed by the AIMS Reef Plan Marine Monitoring Program (MMP), the AIMS Long-term Monitoring Program (LTMP), and other staff either at AIMS or neighbouring institutions including James Cook University (JCU). During the back-to-back coral bleaching summers in 2016 and 2017, the primary temperature instruments deployed were the Vemco Minilog-II-T (https://www.bodc.ac.uk/data/documents/nodb/pdf/minilog2t.pdf) and ReefNet Sensus Ultra (https://reefnet.ca/products/sensus/). Though a significant upgrade is currently underway to upgrade the loggers deployed under this program.
The data for this period has been processed and quality controlled by this NESP 4.2 project. Temperature climatologies have been developed for a select number of sites with sufficiently long records. In addition, the SSTAARS climatology has been used at all locations to provide context to the shorter in situ temperature records.
The data are available through the AIMS Data Catalogue and the Australian Ocean Data Network (AODN) Portal.
 Dr Jessica Benthuysen (Australian Institute of Marine Science)
Description
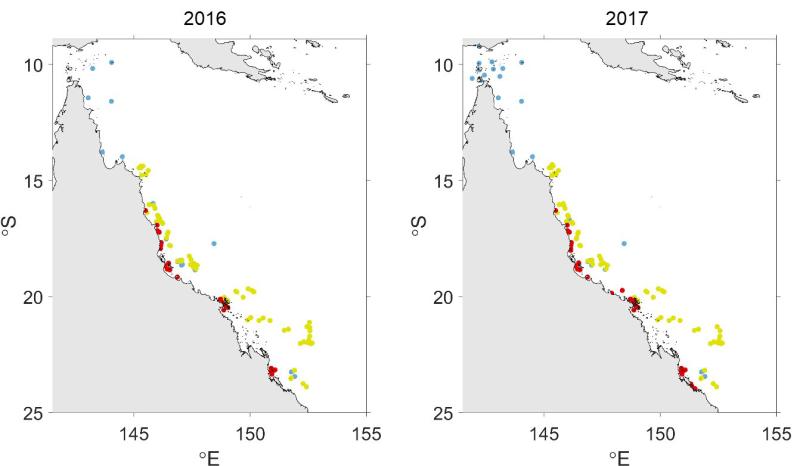
Unique locations with temperature loggers deployed during January to April 2016 (left) and January to April 2017 (right). The colours depict the different programs deploying the loggers : MMP (red), LTMP (yellow), and others (blue).
AIMS Weather Stations
Links to resources:
- Real time data
- Agincourt Reef
- Cleveland Bay
- Davies Reef
- Hardy Reef
- Heron Island
- Lizard Island
- Myrmidon Reef
- One Tree Island
- Square Rocks
- Yongala
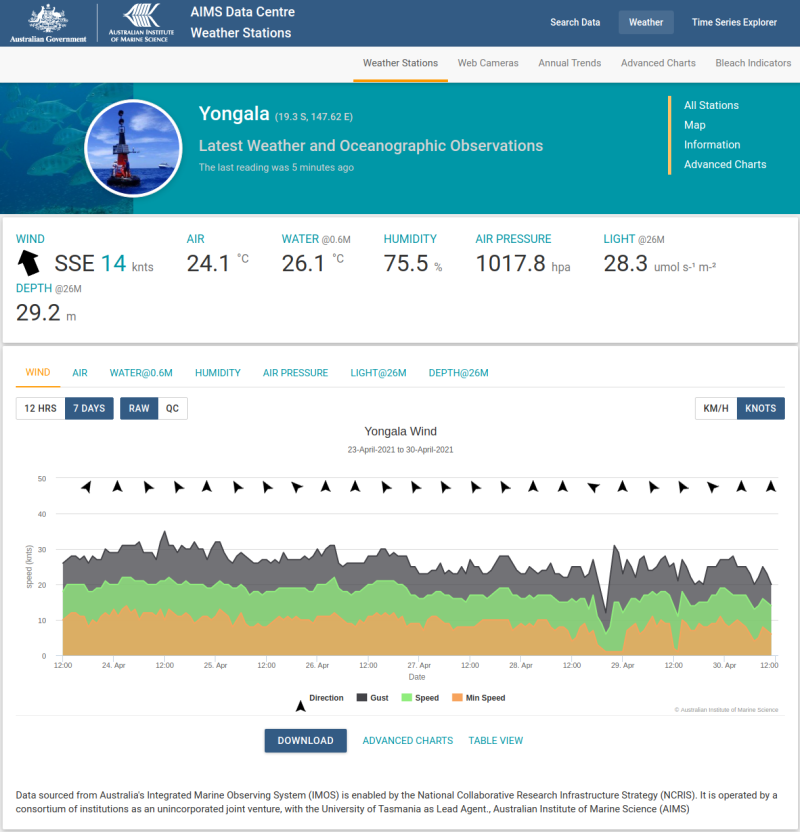
AIMS has a network of 18 weather stations mainly on coral reef locations across Northern Australia that provide essential, real-time data every 10 minutes on above-water meteorological conditions and in-water temperatures across Australia’s tropical marine environment. The data represents the best long-term, on-reef record of climate and climate events in the region. Data can be downloaded from each station via the links above. The advanced charts link allows historical data to be plotted and downloaded in a variety of formats.
A sample plot of the key weather variables is included below.
 Australian Institute of Marine Science
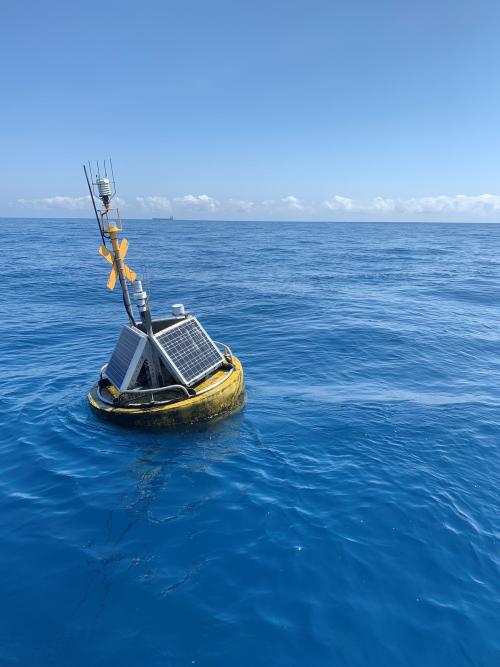
The Yongala National Reference Station surface buoy with meteorological sensors.
IMOS OceanCurrent
Links to resources:
The IMOS OceanCurrent website provides daily satellite sea surface temperature maps around Australia. The website overlays data from other Integrated Marine Observing System (IMOS) platforms (Argo, glider, HF Radar, surface drifting buoys, underway ship temperatures and moorings) providing an excellent resource for an overall picture of the state of Australia's seas. From the website, one can click on the platforms to get a visualisation of the data. From the maps, a user can click on the various platforms that appear on the map to quickly get a visualisation of that specific data platform. Geostrophic currents derived from satellite altimeters are also plotted to help discern the ocean currents. There are also a number of anomaly products and percentiles calculated from the SSTAARS climatology.
During summer 2016 and 2017, large portions of the Northern GBR and Torres Strait were in a marine heatwave. The greatest sea surface temperature anomalies tended to occur in March, after the typical peak in summer temperatures.
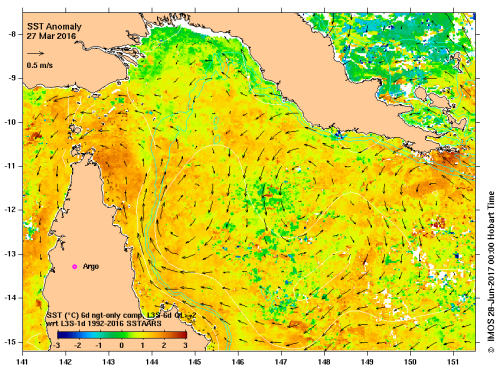
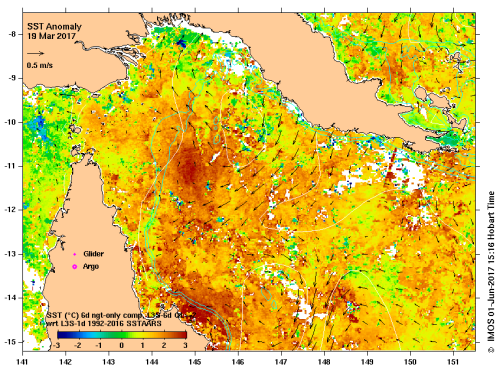
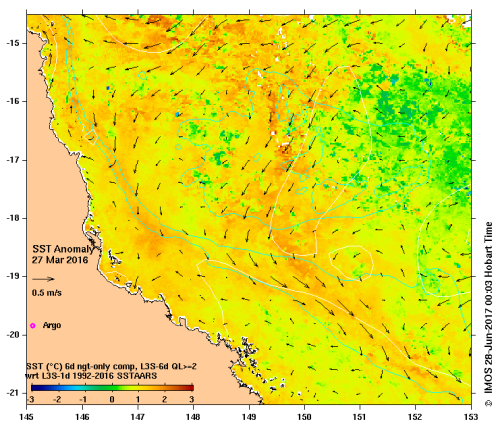
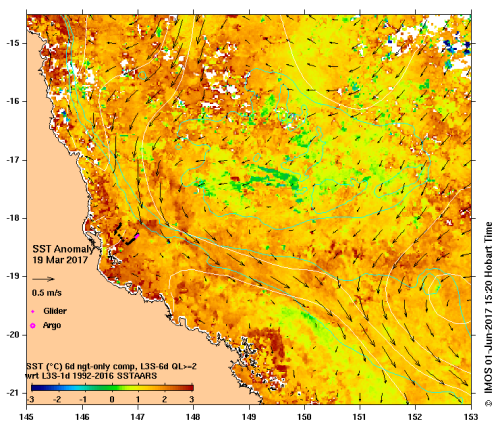
The above figures show the sea surface temperature anomaly (SSTA) from IMOS OceanCurrent, averaged over 6-days, night-time only data, and compared with the SSTAARS climatology (Wijffels et al., 2018).
IMOS Great Barrier Reef Moorings
Links to resources:
- Queensland Moorings
- Deployment Summaries
- Capricorn Channel
- Heron Island South
- Myrmidon Reef
- One Tree East
- Palm Passage
- Yongala National Reference Station
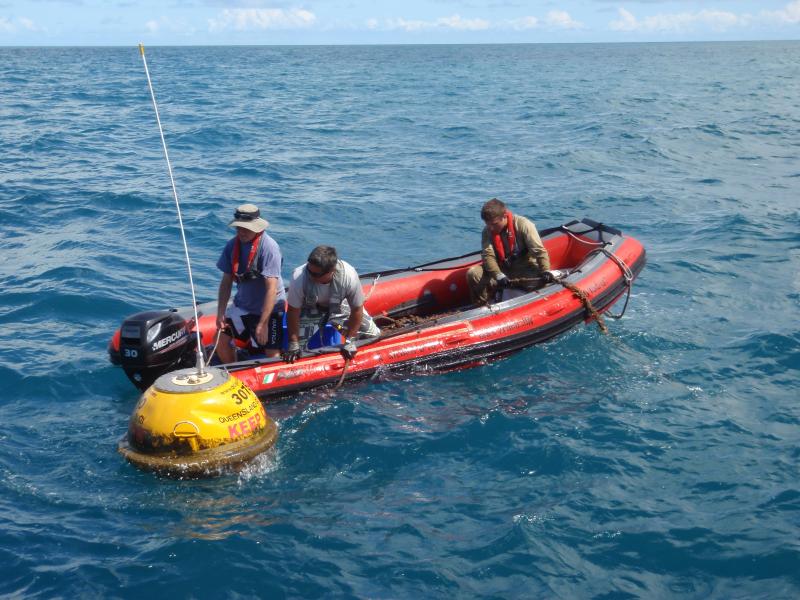
Queensland Moorings collect key oceanographic data from shelf arrays located in the northern tropics along the Great Barrier Reef. The mooring arrays provide near real time and delayed mode observations from oceanographic moorings comprising physical (temperature, salinity, sea level and currents) and water quality measurements (turbidity, fluorescence, PAR). They are one of the few ways sustained measurements of water column structure is made and are useful in determining the thermal stratification caused by spring-summertime warming and also of identifying cold water intrusions. Most of the moorings are on the outer continental shelf and slope away from the coral reefs to provide an understanding of the structure of the open ocean.
 John Luetchford
Description
Moorings are deployed with instruments along a cable through the water column suspended by sub-surface flotation or a surface buoy. Temperature loggers can provide a water column profile to observe the thermal stratification of the water column.
Queensland Government temperatures from the wavebuoy network & tide gauges
Description
The Cape Cleveland wave buoy being recovered. The Queensland wave buoys are arrayed along the Queensland coast providing long term monitoring of waves and temperature. The data is useful for coastal validation of satellite imagery and knowing the sea state during weather events.
The Queensland wave buoys are arrayed along the Queensland coast providing long term monitoring of waves and temperature. The data is useful for coastal validation of satellite imagery and knowing the sea state during weather events.
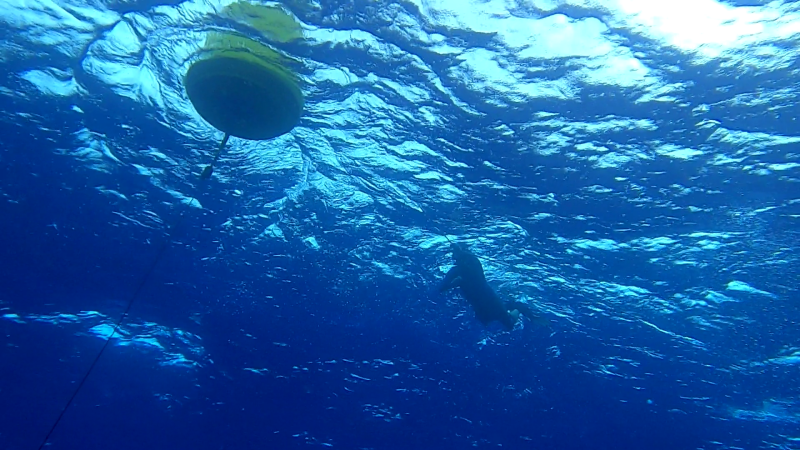
IMOS Gliders
Links to resources:
The first ever Slocum glider deployments in the Central GBR occurred in October 2015 with CSIRO, followed by deployments by ANFOG in November 2015. From 1 October 2015 – 30 April 2016, there were 9 glider deployments. From 1 May 2016 – 30 August 2016, there were 3 glider deployments. There were no glider deployments from September – December 2016.
 Australian Institute of Marine Science
Description
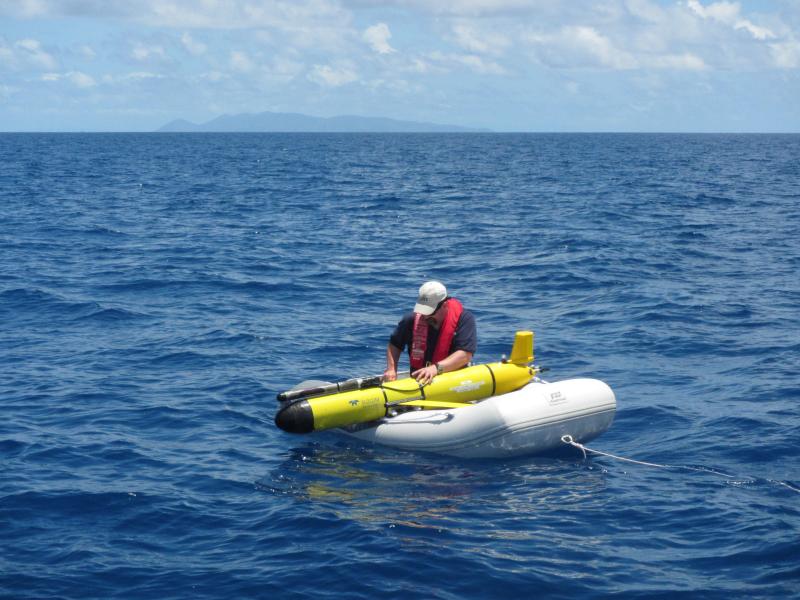
Slocum Glider being prepared for deployment.
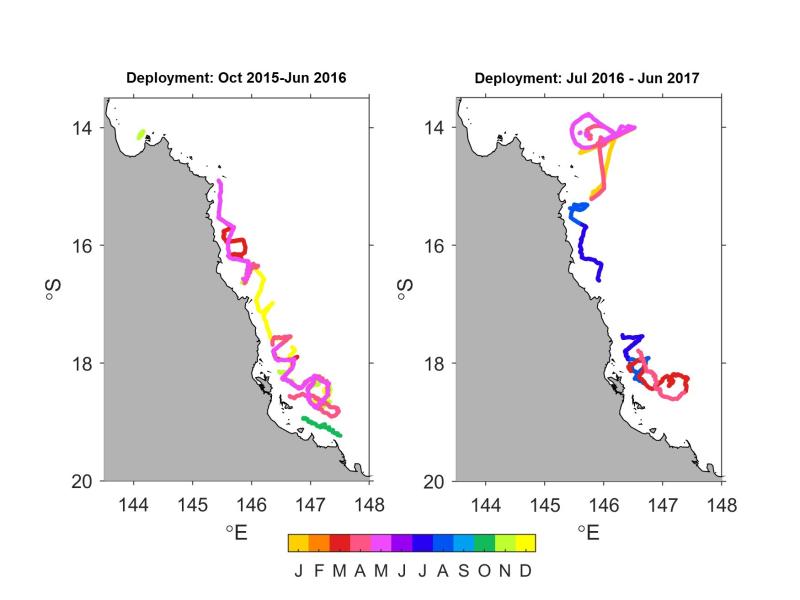
From 1 Jan 2017 – 30 April 2017, there was 1 Slocum glider deployment (shelf) and 2 Seaglider deployments (deep water) near Lizard Island. In total, there were 15 glider deployments from 1 October 2015 – 30 June 2017.
 Dr Jessica Benthuysen (Australian Institute of Marine Science), Data Source: IMOS
Description
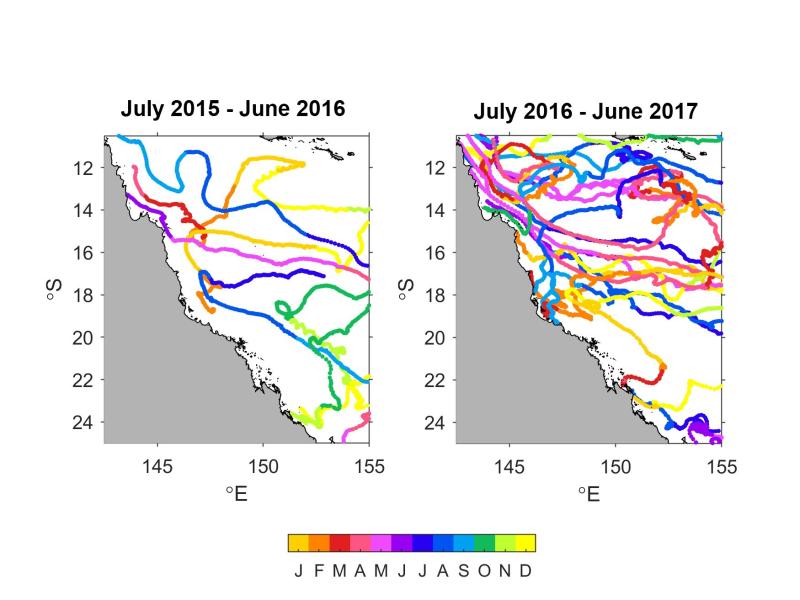
15 glider deployments from 1 October 2015 – 1 July 2017. The trajectories indicate the months (colours) that the waters were sampled. Glider trajectories from (left panel) 1 October 2015 – 30 June 2016 and (right panel) 1 July 2016 – 30 June 2017.
 Dr Jessica Benthuysen (Australian Institute of Marine Science), Data Source: IMOS
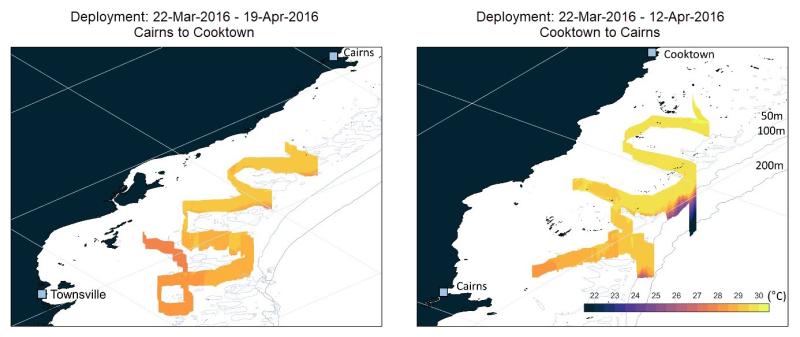
Slocum glider temperatures through the water column during the 2016 marine heatwave in the Great Barrier Reef. The deployments occurred from (left panel) 24 March 2016 – 19 April 2016, Cairns to Cooktown and (right panel) 22 March 2016 – 12 April 2016, Cooktown to Cairns. The same colorscale is applied. Adapted from Benthuysen et al. (2018).
IMOS Ships of Opportunity Underway Thermosalinograph
Links to resources:
Description
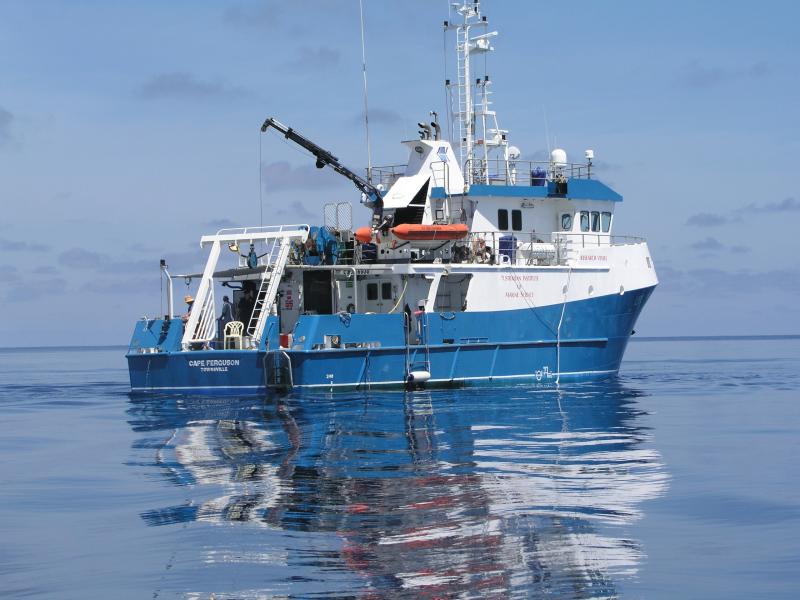
The Research Vessel Cape Ferguson, where a SOOP Thermosalinograph collects 10 second water temperature readings, alongside other water properties.
Through the IMOS Ships of Opportunity – Sensors on Tropical Research Vessels sub-facility, the AIMS R/V Cape Ferguson collects temperature data (and other water properties) with water sampling intake at 1.9 m depth. Water temperature is sampled every 10 sec and data are sent hourly (near real time) to the AIMS Data Centre, Bureau of Meteorology for processing and submission to the Global Telecommunication System, and IMOS to be made available on the AODN Portal.
From 1 Oct 2015 – 30 Apr 2016, data are available from 16 voyages, primarily in the central and southern GBR. From 1 Oct 2016 – 30 Apr 2017, data are available from 17 voyages. The AIMS ship temperature data set is available from the AIMS Data Catalogue and the AODN Portal.
Over these time periods, there were only two voyages for RTM Wakmatha, which collected temperature data and other water properties, during late March 2016 and early April 2016 (not shown; data available from the AODN Portal).
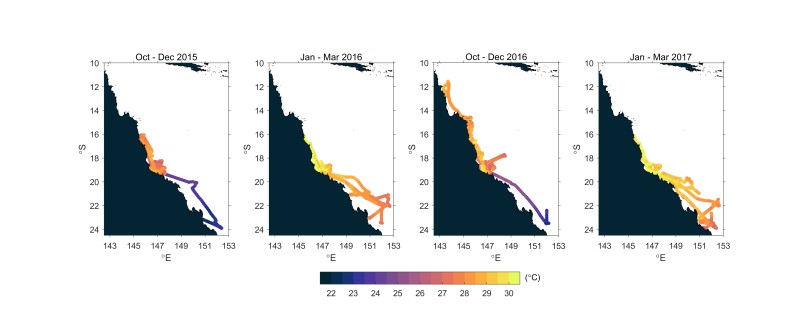 Dr Jessica Benthuysen (Australian Institute of Marine Science), Data Source: IMOS
AIMS R/V Cape Ferguson voyage tracks and hourly-averaged temperature data from three-month periods from 2015-2017.
We can use the ship temperature data to compare with remotely sensed sea surface temperature (SST) products. As an example, the R/V Cape Ferguson 10 sec data is hourly averaged data during February - March 2016 and compared with the nearest daily value from the NOAA OI SST V2.0 0.25° temperature product. Over this time, there is 42 days of ship temperature data. There is relatively good agreement between the ship underway temperature and sea surface temperature.
During this period, the R/V Cape Ferguson was in the Central to Northern G in February and the peak of the marine heatwave occurred in early March. In March, the ship was in the Southern GBR and sampled through cooler waters that were not in a marine heatwave related to the passage of wind events from Tropical Cyclone Winston (Bainbridge et al. 2017).
We can use the Hobday et al. (2016) definition (climatology from 1982-2015) with the 90th percentile threshold and 5 days criteria to determine when MHWs occur at each location. The OISST V2 plot shows the values nearest to the underway data at that time based on the closest coordinate. The maximum OISST anomaly was +1.89°C on 17 Feb 2016 off Cape Cleveland. The ship sampled waters in a marine heatwave 15% of that entire period.
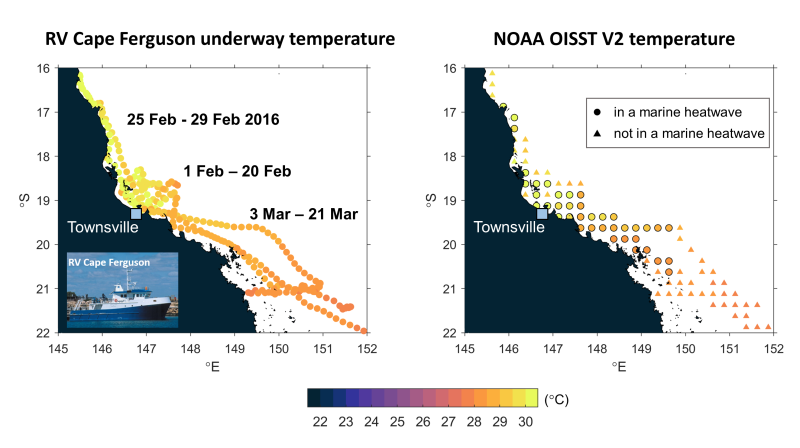 Dr Jessica Benthuysen (Australian Institute of Marine Science), Data Source: SSTAARS and IMOS OceanCurrent
Example of using temperature data from the AIMS R/V Cape Ferguson to detect marine heatwaves in comparison with NOAA OISST V2.0 daily temperature data. The ship temperature data has been compared with other remotely sensed sea surface temperature products to characterise temperature anomalies and extremes. On IMOS OceanCurrent remotely sensed SST and ship temperature data are plotted against monthly climatology SST and SST percentiles from the Sea Surface Temperature Atlas of Australian Regional Seas (SSTAARS;, Wijffels et al. 2018)
The ship temperature data has been compared with other remotely sensed sea surface temperature products to characterise temperature anomalies and extremes. On IMOS OceanCurrent, remotely sensed SST and ship temperature data are plotted against monthly climatology SST and SST percentiles from the Sea Surface Temperature Atlas of Australian Regional Seas (SSTAARS, Wijffels et al. 2018).
AOML surface drifting buoys (NOAA’s Global Drifter Program)
Links to resources:
Surface drifting buoys measure temperature at 20-30 cm depth. This temperature data is used by satellite algorithm developers to calibrate and validate remotely sensed sea surface temperatures. From 1 July 2015 – 1 July 2017, there were 28 total drifters that entered into the GBR Marine Park. Between the two years, 7 drifters from 1 July 2015 – 1 July 2016 and 22 drifters from 1 July 2016 – 1 July 2017 (with in the overlapping period).
 Dr Jessica Benthuysen (Australian Institute of Marine Science), Data Source: IMOS
Description
Surface drifting buoys trajectories from the AOML database to 30 April 2018 for the periods (left panel) 1 July 2015 – 30 June 2016 and (right panel) 1 July 2016 – 30 June 2017. At a particular location, the color represents the month over which that drifter traversed that position.
SST Atlas of Australian Regional Seas (SSTAARS) Climatology
Links to resources:
This is a foundation SST product that is increasingly being used to calculate anomalies and percentiles around Australia. The daily SST product at 2km resolution is produced from 25 years of de-biased and navigated sea surface temperature data from NOAA Polar Orbiting Environmental Satellites received from six Australian and two Antarctic reception stations following international GHRSST principles (Wijffels et al., 2018). The atlas reveals unprecedented detail of regional oceanographic phenomena, including tidally-driven entrainment cooling over shelves and reef flats, wind-driven upwelling, shelf winter water fronts, cold river plumes, the footprint of the seasonal boundary current flows and standing mesoscale features in the major offshore currents.
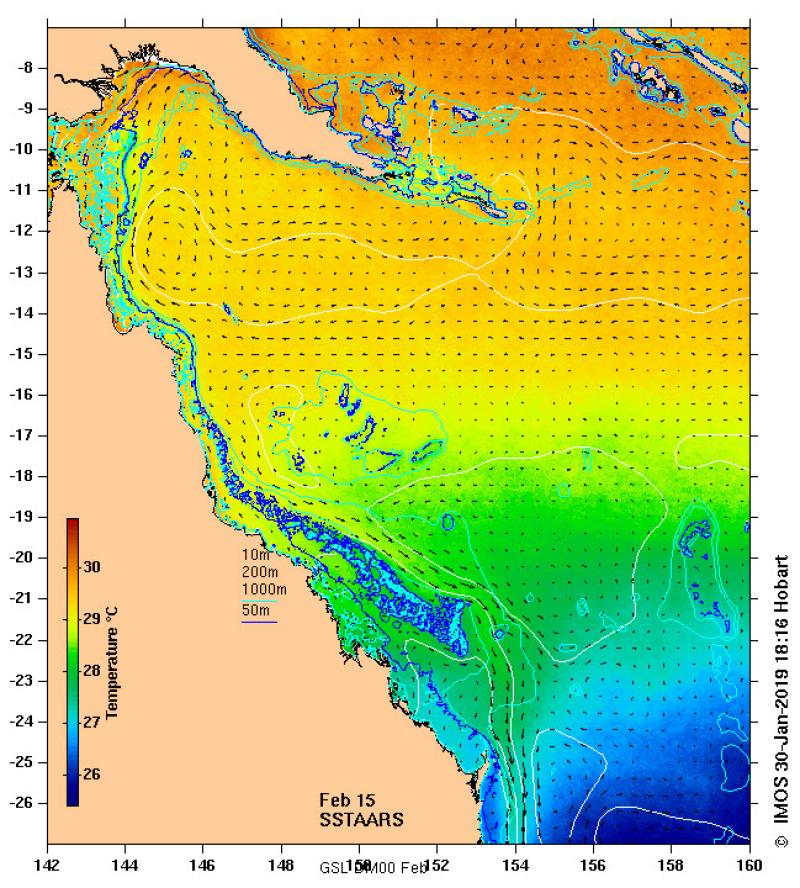
Description
TCB
In Situ Temperature Climatologies
Links to resources:
Daily climatologies of the GBR temperature loggers have been made at over 80 reef flat or slope locations where the records length and data quality is deemed to be sufficient and is based on the hourly registers from loggers with 10 or more years of data. Only data up to 2012 has been used to exclude the more recent rapid warming. They are being used to help calculate anomaly products so that coral bleaching metrics can then be calculated and compared with other satellite derived products such as the NOAA degree heating weeks products.
The link above provides a link to download all of the data with scripts that generated the climatology. The data is then plotted as per the figure below.

Acknowledgements
IMOS is supported by the Australian Government, through the National Collaborative Infrastructure Strategy and the Super Science Initiative. It is led by the University of Tasmania on behalf of the Australian marine and climate science community. Queensland's IMOS (Q-IMOS) is a regional node of IMOS and is supported by the Queensland State Government, the Australian Institute of Marine Science and the University of Western Australia.
References
- Australian Institute of Marine Science (AIMS). (2019). Temperature Loggers Climatology for the GBR region (NESP TWQ 4.2, AIMS), https://apps.aims.gov.au/metadata/view/75c9c4a9-f37f-45a6-9532-053506b43bd9, accessed 12-Feb-2021.
- Bainbridge, S. J. (2017). Temperature and light patterns at four reefs along the Great Barrier Reef during the 2015–2016 austral summer: understanding patterns of observed coral bleaching. Journal of Operational Oceanography, 10(1), 16-29, https://doi.org/10.1080/1755876X.2017.1290863
- Benthuysen, J. A., Oliver, E. C., Feng, M., & Marshall, A. G. (2018). Extreme marine warming across tropical Australia during austral summer 2015–2016. Journal of Geophysical Research: Oceans, 123(2), 1301-1326.
- Hobday, A. J., Alexander, L. V., Perkins, S. E., Smale, D. A., Straub, S. C., Oliver, E. C., ... & Holbrook, N. J. (2016). A hierarchical approach to defining marine heatwaves. Progress in Oceanography, 141, 227-238.
- IMOS 2020, Integrated Marine Observing System Ships of Opportunity-Sensors on Tropical Research Vessels, https://portal.aodn.org.au/, accessed [01-May-2020].
- Steinberg, C.R., J. Benthuysen, E. Klein-Salas, N.E. Cantin, H. Tonin, S. Spagnol and C.M. Spillman (2021) Oceanographic drivers of bleaching in the GBR: from observations to prediction, Volume 1: Summary of oceanographic conditions during the 2015-17 bleaching years. Report to the National Environmental Science Program. Reef and Rainforest Research Centre Limited, Cairns (49pp).
- Wijffels SE, Beggs H, Griffin C, Middleton JF, Cahill M, King E, Jones E, Feng M, Benthuysen JA, Steinberg CR, Sutton P (2018) A fine spatial-scale sea surface temperature atlas of the Australian regional seas (SSTAARS): Seasonal variability and trends around Australasia and New Zealand revisited. Journal of Marine Systems187: 156-196 https://doi.org/10.1016/j.jmarsys.2018.07.005