Description
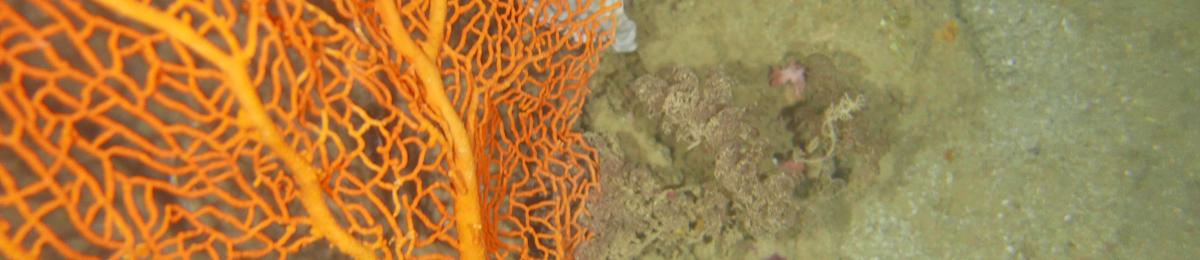
Still photo from towed video Area 1 Tow 3 as part of the NWS2S program.
[ Why did we do this study? What did we do? What did we find? ]
AIMS acknowledges the Yinggarda, Baiyungu, Thalanyji, Yaburara, Mardudhunera, Ngarluma, Yindjibarndi, Ngarla, Bindunbur and Bardi Jawi People, as Traditional Owners of the Country adjacent to the Ancient Coastline where this North West Shoals to Shore Research Program work was undertaken. We recognise these People’s ongoing spiritual and physical connection to Country and pay our respects to their Aboriginal Elders past, present and emerging.
This study was conducted as part of AIMS’ North West Shoals to Shore Research Program and was supported by Santos as part of the company’s commitment to better understand Western Australia’s marine environment.
Why did we do this study?
Key Ecological Features (KEFs) are parts of the marine ecosystem considered to be of particular importance for either a region's biodiversity or its ecosystem function and integrity (see them all). This could relate to a species integral to a community (e.g. an apex predator), an important habitat type (e.g. that supports high productivity or aggregations of breeding animals), or a unique seafloor feature that positively impacts the surrounding ecosystem (e.g. a deep canyon that stimulates upwellings of nutrient rich water).
13 KEFs have been defined for Australia’s North-west Marine Region, including the ‘Ancient Coastline at 125m depth contour’ (AC125). The AC125 is thought to “provide areas of hard substrate and therefore may provide sites for higher diversity and enhanced species richness relative to surrounding areas of predominantly soft sediment.” Little is known about what habitats exist on the sea floor in the AC125. Part of the reason is that the AC125 is very deep, and thus difficult to observe.
What did we do?
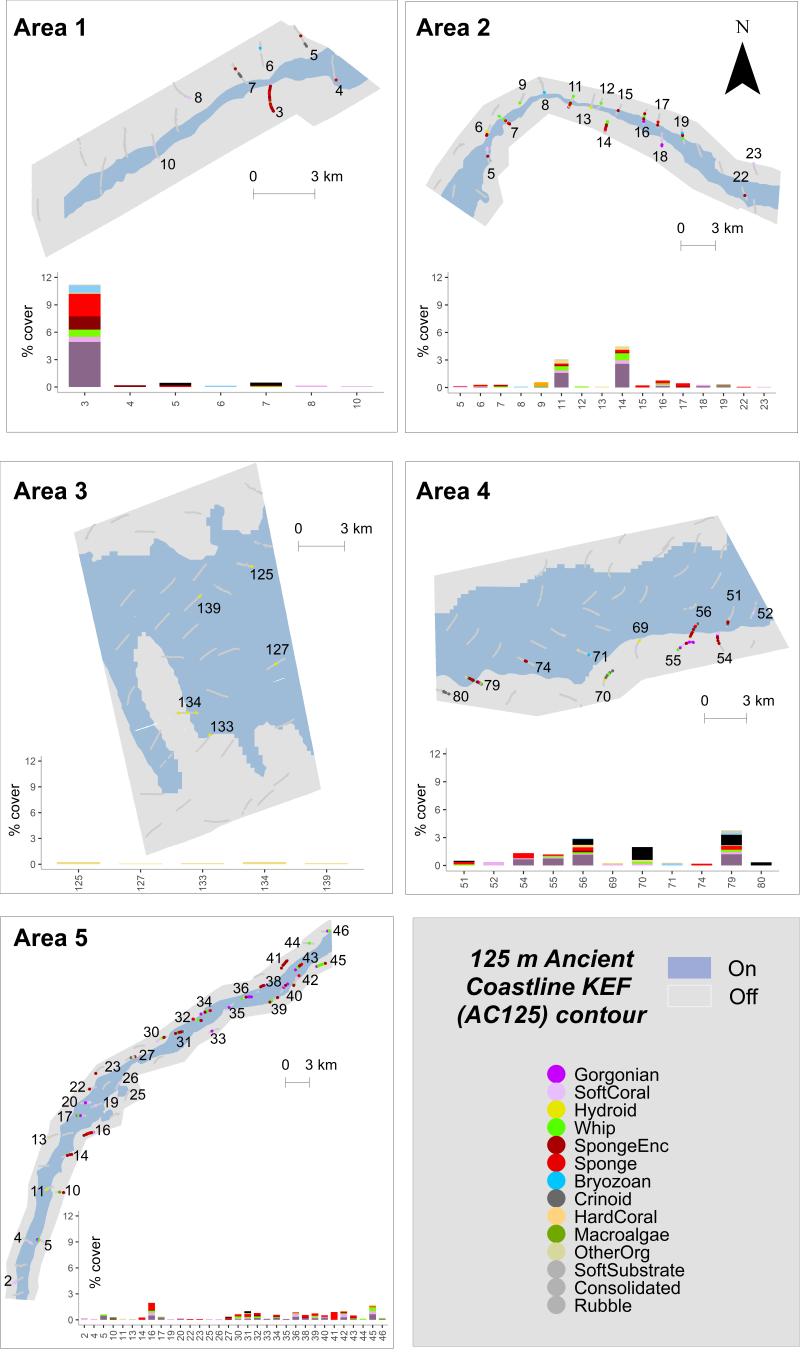
The North West Shoals to Shore Research Program investigated seabed habitats and their biodiversity to inform management and sustainable development of the region. We took underwater photographs and video of the seafloor using an underwater video system we towed behind the Australian Institute of Marine Science's vessel RV Solander. Five study areas ('Areas') along the extensive AC125 feature (depth range 115 – 135 m, red on the map below) were surveyed, including parts of the seafloor landward (shallower) and seaward (deeper) of this feature (grey). These tows, both on and off the AC125, were undertaken to understand each AC125 Area within its local context.
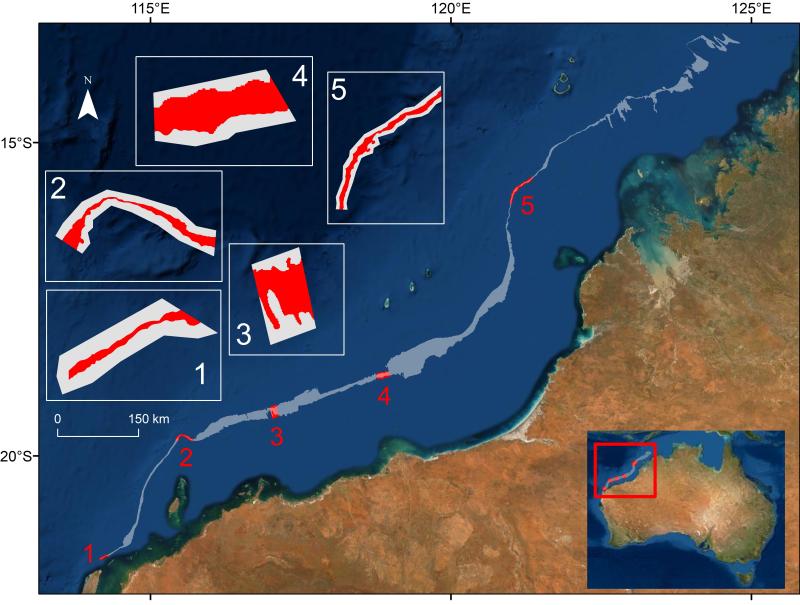
Look at the map below to see where underwater photographs and videos were taken in each Area. The legend in the bottom right panel shows the type of organism each colour represents. Charts below each map show the percent cover of organism types observed along each tow during surveys. Tows that are not numbered or included in the charts did not have any organisms recorded on them. Click on each panel of the map to see a larger version in a new window.
On each tow, we captured two types of imagery:
- Forward pointing video, and
- Downward pointing still images.
To help understand the benefits and limits of each method of data collection, read How do we measure what we see along a tow? Note that visibility is poor for some video segments (e.g. white particles - ‘snow’ - in the water, an up and down motion). This happens when strong currents stir up soft sediment from the bottom and also make the tow body difficult to steer.
What did we find?
The five Areas were dominated by soft sediments (sand and silt) which supported very little epibiota (e.g., organisms growing on the surface), interspersed with patches of consolidated subtrate (hard ground) supporting established filter feeder communities. You can see on the map above that many tows contained relatively few organisms. Below are examples of both forward pointing video in each Area (jump directly to Area 1 - Area 2 - Area 3 - Area 4 - Area 5).
Area 1
Area 1 has the steepest slope of the five study areas which means, compared to other Areas, depth on tows heading down a slope increased relatively quickly. Most of the 12 tows we ran were dominated by soft sediment (silt, sand and gravel), apart from Tow 3.
Area 1 Tow 3 (see it on the map) had the highest percent cover of living organisms (mainly gorgonian fans and sponges) of any tow across the study and was also the shallowest. It is positioned landward of the AC125 feature (i.e. towards the coast). This segment is from the start of the tow in depths about 65 m and gets progressively deeper. The seafloor is consolidated (e.g. hard, not loose). This enables the growth of gorgonian fans and sponges, as they need to attach to something solid. Often consolidated substrate lies beneath a veneer of sand and is not clearly visible but is assumed to exist when organisms that require it are present.
Area 1 Tow 4 (see it on the map) is positioned on the AC125 in depths of 123 – 131 m. This segment is from the start of the tow (~ 123 m) and although there is a lot of soft sediment, small patches of organisms indicate that “bits” of consolidated substrate must be present.
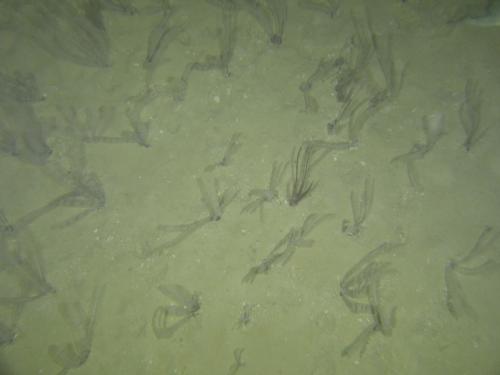
Area 1 Tow 7 (see it on the map) is located off the AC125 in deeper water (135 – 159 m), and features numerous crinoids (feather stars) on soft sediment as shown on the still image below.
Description
Still photo from towed video Area 1 Tow 7 as part of the NWS2S program.
Area 1 Tow 12 (see it on the map) is almost entirely soft sediment. It is located off the AC125 in deep water (144 – 166 m).
Area 2
Eight of the twenty-four tows in Area 2 were made up mainly of soft sediment. On tows where the seafloor was consolidated, more organisms could attach and grow up into the water column. Most of these organisms are filter feeders, that is, they filter the seawater for food.
Area 2 Tow 9 (see it on the map) is the only tow where hard coral was seen. We think this coral might be Lophelia pertusa – a deep water reef building coral that does not contain zooxanthellae, the symbiotic algae which lives inside most tropical reef building corals. It occurred on this tow at depths between 152 and 154 m, and is the small, white branching colony. Here are three close-up examples of what it looks like in still images from the tow.
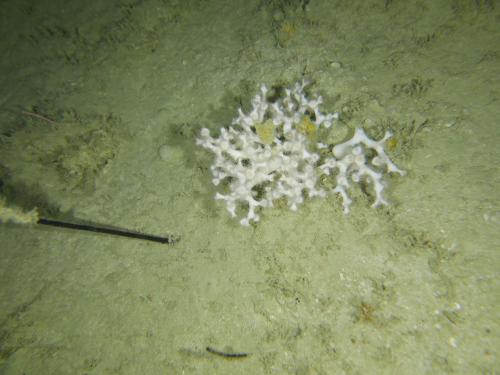
Description
Still photo from towed video Area 2 Tow 9 as part of the NWS2S program.
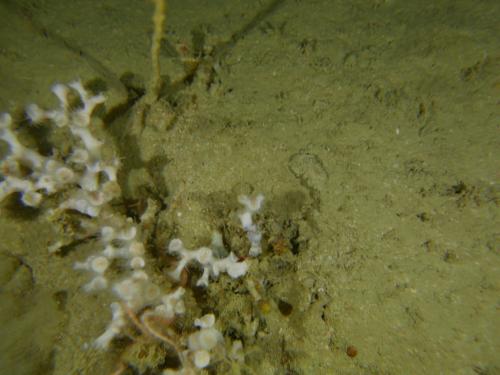
Description
Still photo from towed video Area 2 Tow 9 as part of the NWS2S program.
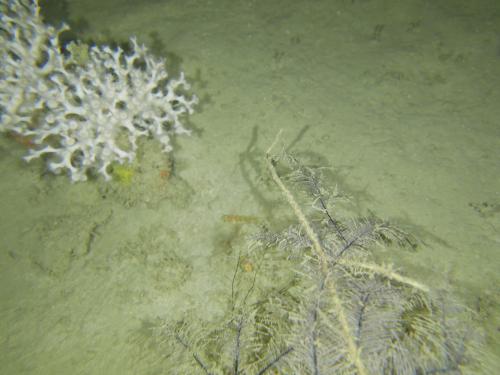
Description
Still photo from towed video Area 2 Tow 9 as part of the NWS2S program.
Area 2 Tow 11 (see it on the map) has the second highest cover of biota for this Area and starts shallower than the AC125, runs across the AC125 and then into deeper waters off the AC125. Some beautiful, colourful and large gorgonian fans feature in this segment of the tow, which corresponds roughly to the section that traverses the AC125. Different growth forms of sponge can also be seen (e.g. cup, branching and laminar). The size of organisms in this video indicate a well-established community that has existed here for some time.
Area 2 Tow 14 (see it on the map) had the highest cover of biota for this Area, and was positioned shallower than the AC125, with depth ranging from 93-110 m. This tow consists mainly of gorgonian fans, sponges, whips and hydroids which filter their food from the water.
Area 3
This study Area was quite different to the others as it was much flatter and almost entirely covered by soft sediment. It may be that hard substrate is buried beneath a soft sediment layer which has infilled this Area of the AC125. Depth ranged from 112 – 150 m across the 34 tows we ran.
Area 3 Tow 145 (see it on the map) is typical of tows in this Area. Hardly any biota is apparent. However, hollows and holes in the sediment are evidence that animals called infauna live in the sediment. In this study, we did not take samples of the sediment to determine which species of infauna animals exist there.
Area 4
Thirty-seven tows were undertaken across this Area. Like Area 3, this area was flatter than the other Areas with depth ranging from 105 - 139 m. The seafloor was sandy but also had rubble and small blocks of consolidated substrate.
Area 4 Tow 56 (see it on the map) shows a filter feeder community (gorgonian fans, sponges, whips, hydroids etc) on a seafloor that is soft sediment with patches of rubble. It starts shallower than the AC125 and then runs onto the AC125 (depth 109 – 125 m). These patches of rubble and consolidated substrate are important for attachment by filter feeders, but also because they provide a place above the seafloor where encrusting and fine branching animals (such as encrusting sponges and bryozoans) are not smothered by sediment.
Area 4 Tow 79 (see it on the map) starts on the AC125 and runs into shallower waters (107 m) off the AC125. Small patches of consolidated rubble/block with filter feeders are interspersed with areas of soft sediment.
Area 5
Area 5 had 41 tows and a moderate slope compared to Areas 1 and 2. Depth ranged from 92 – 171 m and, unlike the other Areas, it did not have many tows which were completely devoid of living organisms.
Area 5 Tow 16 (see it on the map) has the highest biotic cover for this Area and is shallower than the AC125 (95 – 104 m). It has an interesting seafloor, supporting a notable filter feeder community.
Area 5 Tow 36 (see it on the map) is located on the AC125. The visibility (water clarity) on this tow is high, and it is dominated by rubble and consolidated substrate with sparse biota. Towards the end of the segment, sand waves are visible.
Area 5 Tow 41 (see it on the map) is a deep tow (143 – 166 m) located seaward of the AC125 with a seafloor made up of soft sediment and bits of rubble. The biota living here is concentrated around the bits of rubble.
Metadata: https://apps.aims.gov.au/metadata/view/6b325d80-a983-452a-97e6-39bb723245e6
How do we measure what is seen along a tow?
Two types of imagery were captured from which to measure what can be seen along a tow:
- Forward pointing video, and
- Downward pointing still images.
The forward pointing video is sent directly to the boat (in real-time) and allows an operator to ‘fly’ the towed video body above the seafloor. A marine biologist watches the video and records what is seen into a computer program. The field of view in the video is relative wide as it projects forward, and is better at showing organisms that grow up into the water column (like sponges, gorgonian fans, sea whips). It is likely to miss or understimate the number of organisms that are small and lie flat on the sea floor (like encrusting or plate corals). Below is the forward pointing video for Area 1, Tow 3.
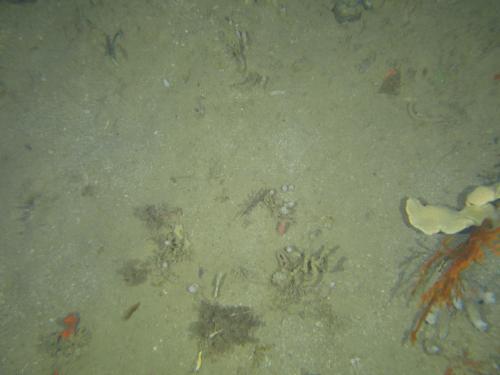
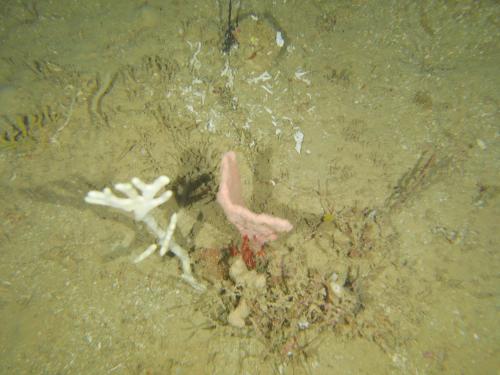
Downward facing still images are taken about every 8 seconds along the seafloor and are used to quantify what is observed. To do this, each image is overlaid with five points and whatever lies beneath these five points is recorded. The downward pointing images can underestimate the cover of biota, especially if it grows up into the water column (such as gorgonian fans, whips) and not across the seafloor (such as encrusting or plate corals). Compare the video for Area 1, Tow 3 (above) to the examples below of downward point still images taken along the same tow.
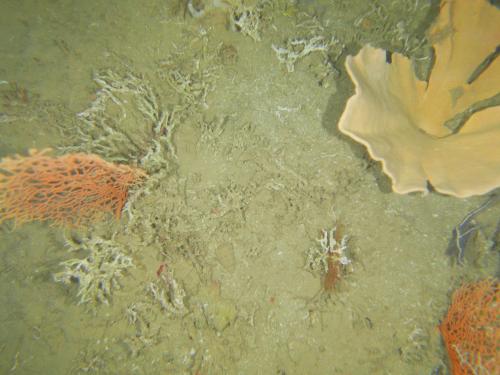
Description
Still photo from towed video Area 1 Tow 3 as part of the NWS2S program.
Description
Still photo from towed video Area 1 Tow 3 as part of the NWS2S program.
Description
Still photo from towed video Area 1 Tow 3 as part of the NWS2S program.
From this comparison, you can see that 11.2% biotic cover estimated from the still images (as indicated in the stacked bar plot for Tow 3 in Area 1) seems low compared to what you saw on the video. This happened because the tow was dominated by organisms like gorgonians, sponges and sea whips which are harder to measure accurately with the still images.