 eAtlas Data Catalogue
Marine
Type of resources
Topics
Keywords
Contact for the resource
Provided by
Representation types
Update frequencies
status
Scale
-
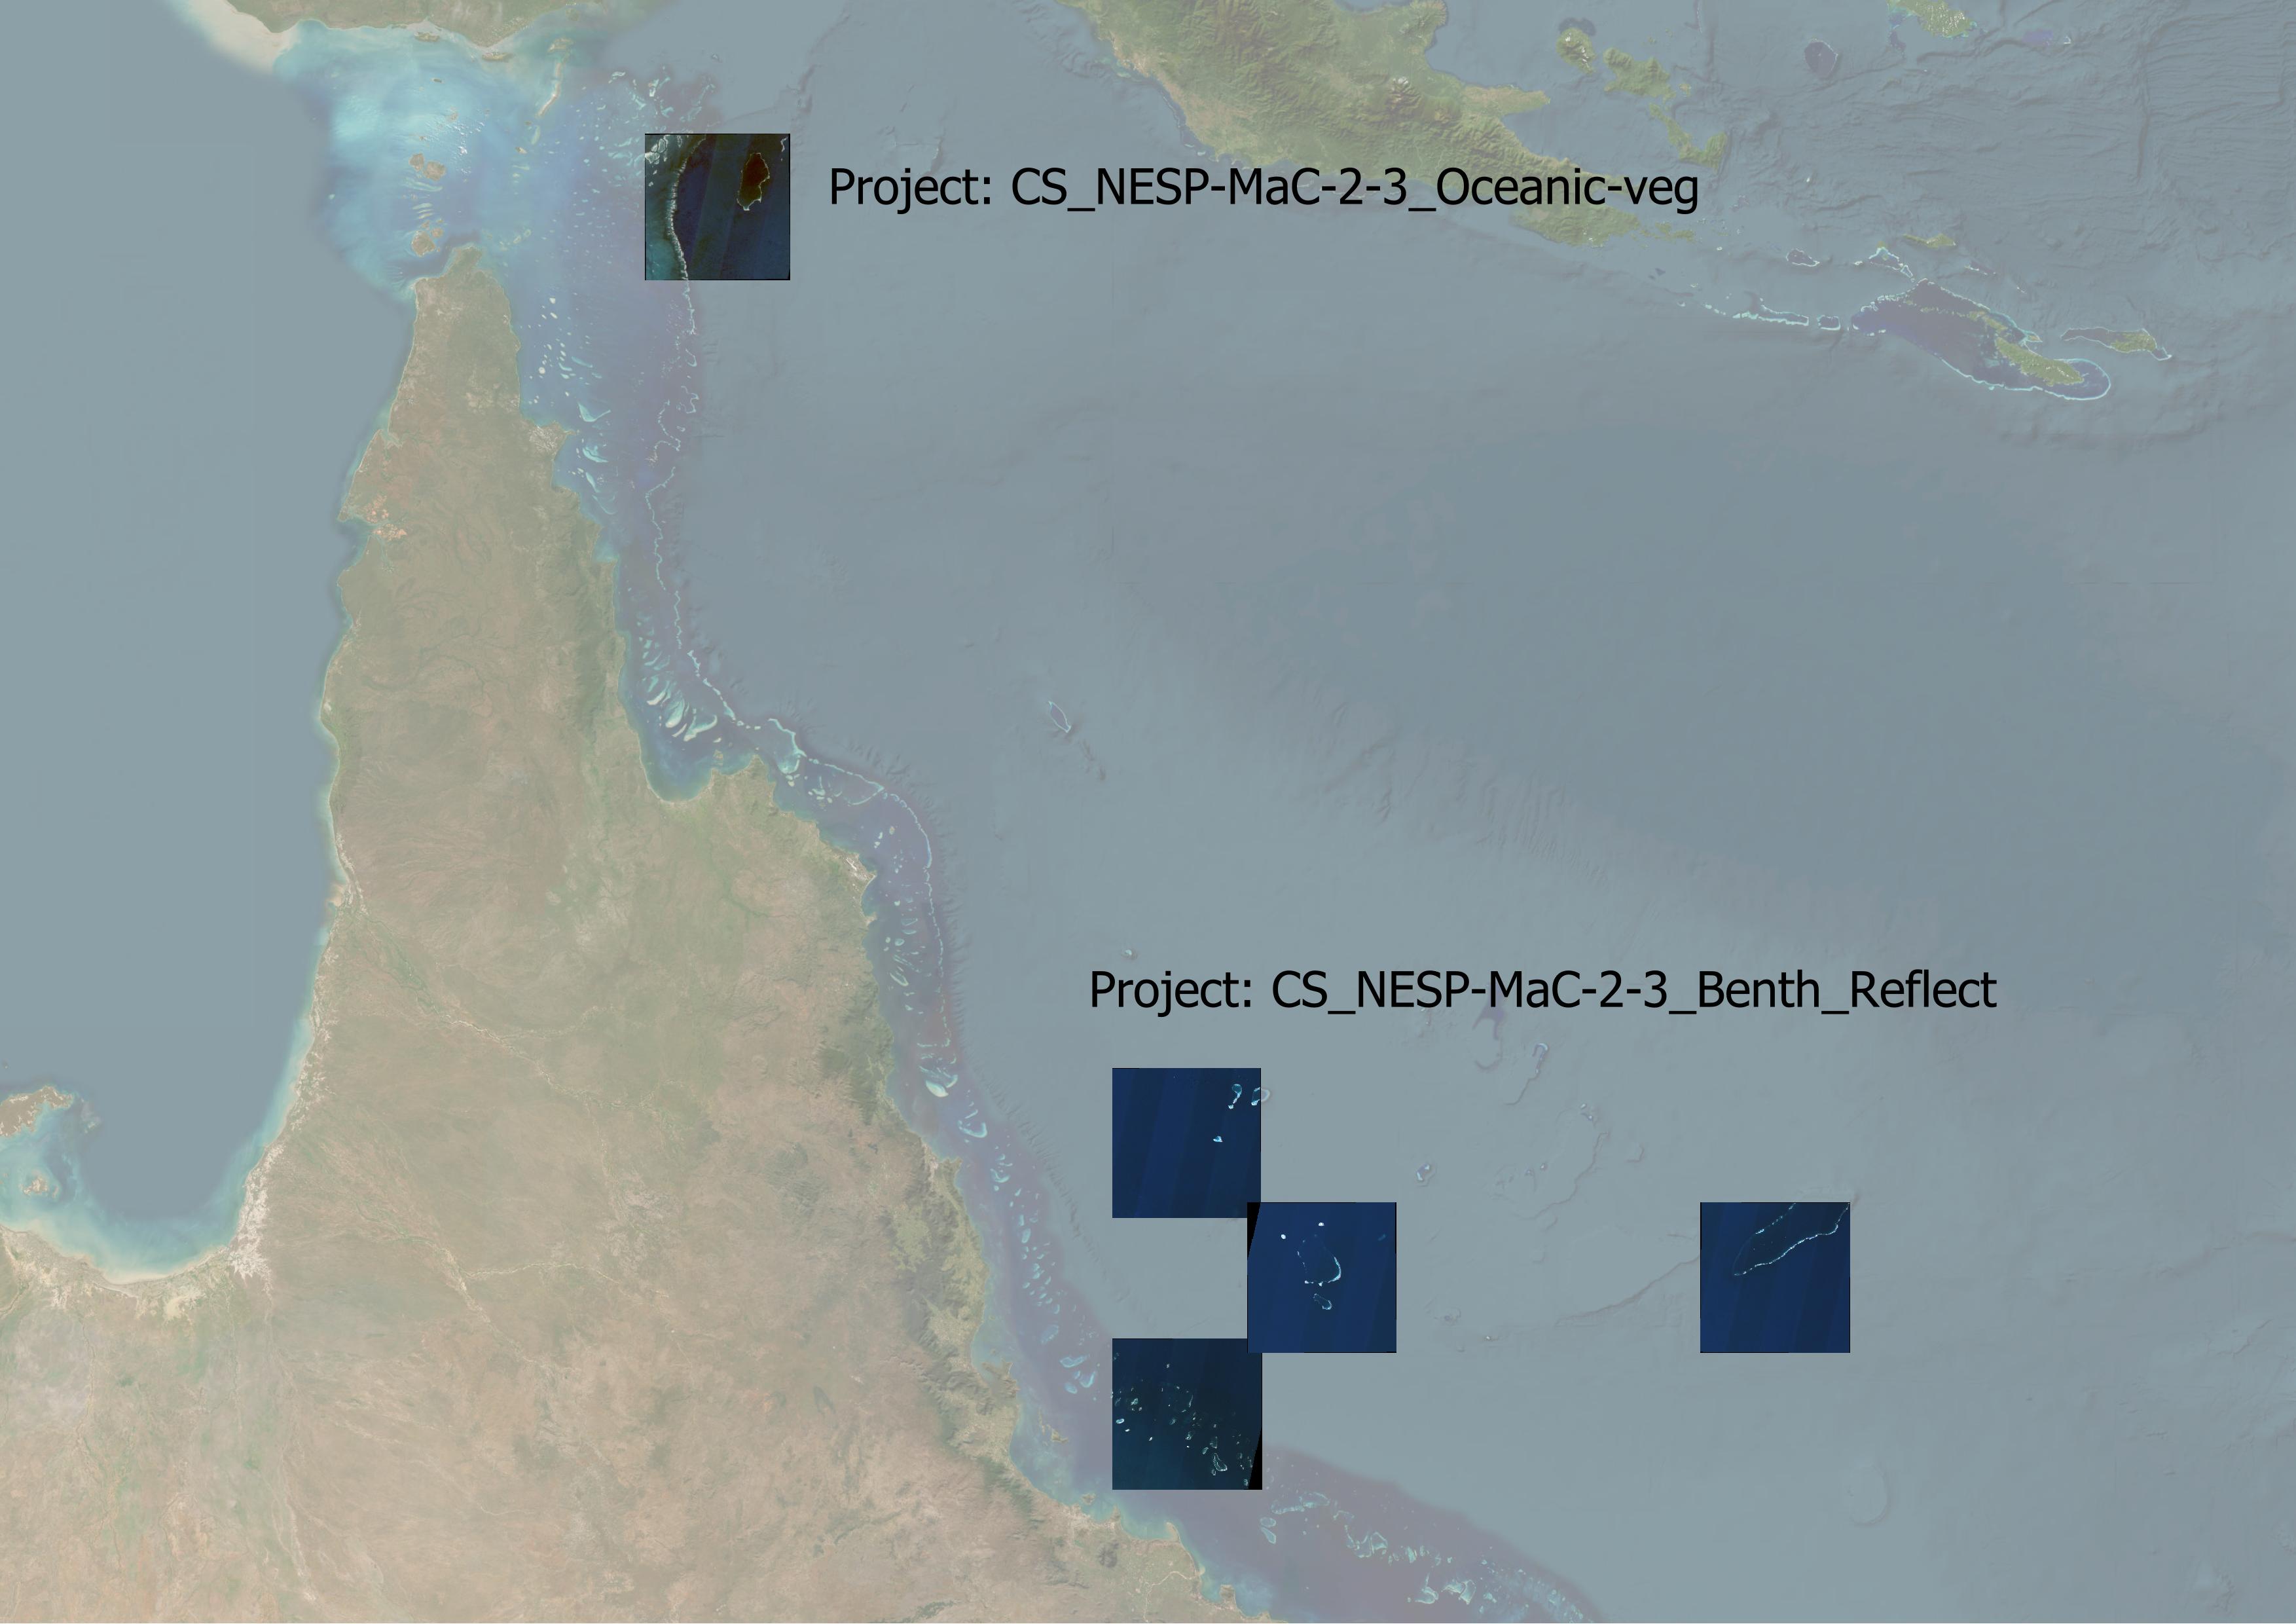
This dataset consists of collections of satellite image composites (Sentinel 2 and Landsat 8) that are created from manually curated image dates for a range of projects. These images are typically prepared for subsequent analysis or testing of analysis algorithms as part of other projects. This dataset acts as a repository of reproducible test sets of images processed from Google Earth Engine using a standardised workflow. Details of the algorithms used to produce the imagery are described in the GEE code and code repository available on GitHub (https://github.com/eatlas/World_AIMS_Marine-satellite-imagery). Project test image sets: As new projects are added to this dataset, their details will be described here: - NESP MaC 2.3 Benthic reflection estimation (projects/CS_NESP-MaC-2-3_AIMS_Benth-reflect): This collection consists of six Sentinel 2 image composites in the Coral Sea and GBR for the purpose of testing a method of determining benthic reflectance of deep lagoonal areas of coral atolls. These image composites are in GeoTiff format, using 16-bit encoding and LZW compression. These images do not have internal image pyramids to save on space. [Status: final and available for download] - NESP MaC 2.3 Oceanic Vegetation (projects/CS_NESP-MaC-2-3_AIMS_Oceanic-veg): This project is focused on mapping vegetation on the bottom of coral atolls in the Coral Sea. This collection consists of additional images of Ashmore Reef. The lagoonal area of Ashmore has low visibility due to coloured dissolved organic matter, making it very hard to distinguish areas that are covered in vegetation. These images were manually curated to best show the vegetation. While these are the best images in the Sentinel 2 series up to 2023, they are still not very good. Probably 80 - 90% of the lagoonal benthos is not visible. [Status: final and available for download] - NESP MaC 3.17 Australian reef mapping (projects/AU_NESP-MaC-3-17_AIMS_Reef-mapping): This collection of test images was prepared to determine if creating a composite from manually curated image dates (corresponding to images with the clearest water) would produce a better composite than a fully automated composite based on cloud filtering. The automated composites are described in https://doi.org/10.26274/HD2Z-KM55. This test set also includes composites from low tide imagery. The images in this collection are not yet available for download as the collection of images that will be used in the analysis has not been finalised. [Status: under development, code is available, but not rendered images] - Default (project/default): This collection of manual selected scenes are those that were prepared for the Coral Sea and global areas to test the algorithms used in the developing of the original Google Earth Engine workflow. This can be a good starting point for new test sets. Note that the images described in the default project are not rendered and made available for download to save on storage space. [Status: for reference, code is available, but not rendered images] Filename conventions: The images in this dataset are all named using a naming convention. An example file name is `Wld_AIMS_Marine-sat-img_S2_NoSGC_Raw-B1-B4_54LZP.tif`. The name is made up of: - Dataset name (`Wld_AIMS_Marine-sat-img`), short for World, Australian Institute of Marine Science, Marine Satellite Imagery. - Satellite source: `L8` for Landsat 8 or `S2` for Sentinel 2. - Additional information or purpose: `NoSGC` - No sun glint correction, `R1` best reference imagery set or `R2` second reference imagery. - Colour and contrast enhancement applied (`DeepFalse`, `TrueColour`,`Shallow`,`Depth5m`,`Depth10m`,`Depth20m`,`Raw-B1-B4`), - Image tile (example: Sentinel 2 `54LZP`, Landsat 8 `091086`) Limitations: Only simple atmospheric correction is applied to land areas and as a result the imagery only approximates the bottom of atmosphere reflectance. For the sentinel 2 imagery the sun glint correction algorithm transitions between different correction levels from deep water (B8) to shallow water (B11) and a fixed atmospheric correction for land (bright B8 areas). Slight errors in the tuning of these transitions can result in unnatural tonal steps in the transitions between these areas, particularly in very shallow areas. For the Landsat 8 image processing land areas appear as black from the sun glint correction, which doesn't separately mask out the land. The code for the Landsat 8 imagery is less developed than for the Sentinel 2 imagery. The depth contours are estimated using satellite derived bathymetry that is subject to errors caused by cloud artefacts, substrate darkness, water clarity, calibration issues and uncorrected tides. They were tuned in the clear waters of the Coral Sea. The depth contours in this dataset are RAW and contain many false positives due to clouds. They should not be used without additional dataset cleanup. Change log: As changes are made to the dataset, or additional image collections are added to the dataset then those changes will be recorded here. 1st Edition, 2024-03-18: Initial publication of the dataset, with CS_NESP-MaC-2-3_AIMS_Benth-reflect, CS_NESP-MaC-2-3_AIMS_Oceanic-veg and code for AU_NESP-MaC-3-17_AIMS_Reef-mapping and Default projects. Data Format: GeoTiff images with LZW compression. Most images do not have internal image pyramids to save on storage space. Data Location: This dataset is filed in the eAtlas enduring data repository at: data\custodian\2020-2029-AIMS\Wld-AIMS-Marine-sat-img
-
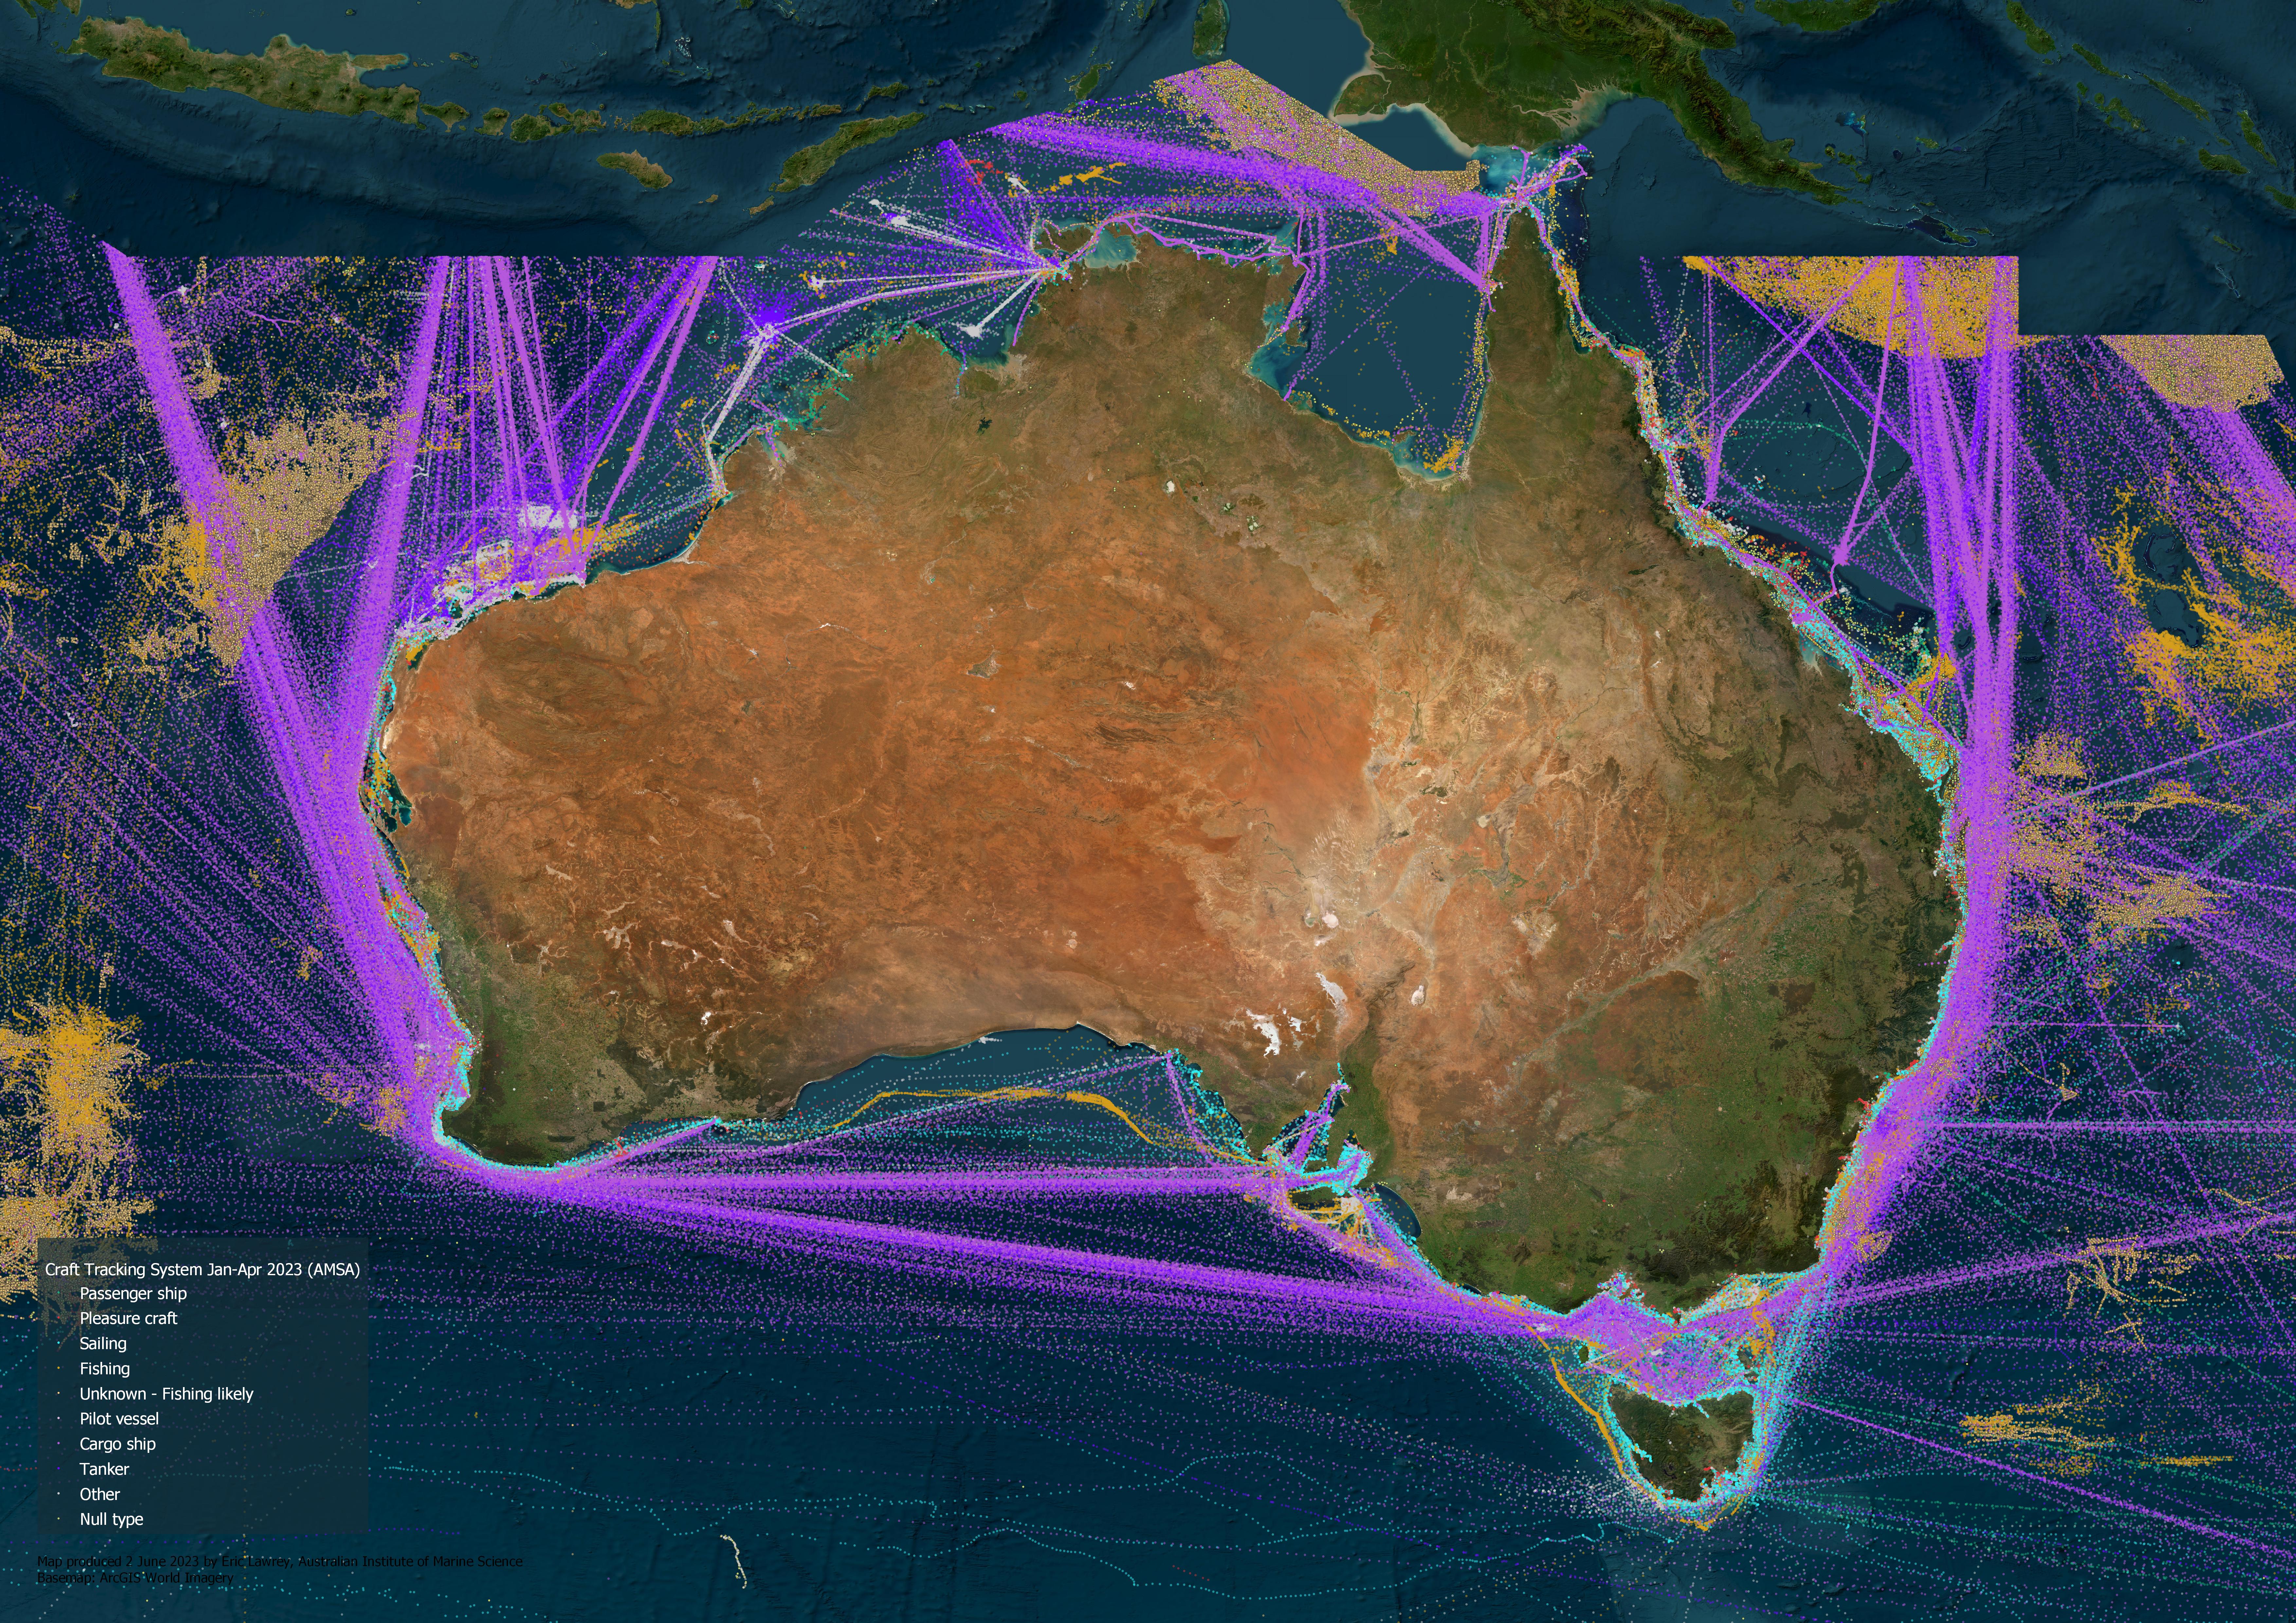
This dataset is an extract and collation of 4 months of data from the Craft Tracking System run by the Australian Maritime Safety Authority (AMSA). This dataset shows the location of cargo ships, fishing vessels, passenger ships, pilot vessels, sailing boats, tankers and other vessel types at 1 hour intervals. The Craft Tracking System (CTS) and Mariweb are AMSA’s vessel traffic databases. They collect vessel traffic data from a variety of sources, including terrestrial and satellite shipborne Automatic Identification System (AIS) data sources. This dataset has been built from AIS data extracted from CTS, and it contains vessel traffic data for January - April 2023. The dataset covers the extents of Australia’s Search and Rescue Region. Each point within the dataset represents a vessel position report and is spatially and temporally defined by geographic coordinates and a Universal Time Coordinate (UTC) timestamp respectively. This dataset is a derivative of the monthly Craft Tracking System data available from https://www.operations.amsa.gov.au/Spatial/DataServices/DigitalData. As such this record is not authoritative about the source data. If you have any queries about the Craft Tracking System data please contact AMSA. Description of the data: This data shows a high volume of cargo ships and tankers traveling between international destinations and the ports of Australia, as well as significant cargo traffic between domestic ports. These vessels tend to travel in straight lines along designated shipping lanes, or along paths that maximize their efficiency on route to their destination. Fishing activities are prominent in international waters, particularly in the Indian Ocean, Coral Sea, and Arafura Seas. The tracking of fishing vessels drops dramatically at the boundary of the Australian Exclusive Economic Zone (EEZ). Most domestic fishing activities appear to be closer to the Australian coast, often concentrating on the edge of the continental shelf. However, the data does not specifically indicate whether the vessels are domestic or international. Western Australia exhibits a great deal of vessel activity associated with the oil and gas industry. Each of these platforms is serviced by tugboats and tankers. At large ports, dozens of cargo ships wait in grid patterns to transit into the port. Shipping traffic in most of the Gulf of Carpentaria is relatively sparse, as the majority of cargo vessels travel from Torres Strait west into the Arafura Sea, bypassing the gulf. However, there is a noticeable concentration of fishing activity along the coast around Karumba and the Wellesley Islands, presumably associated with the prawning industry. Along the Queensland coastline, vessel traffic is dominated by cargo ships, which travel in designated shipping areas between the Great Barrier Reef and the mainland. There are three passages through the reef off Hay Point (Hydrographers Passage), north of Townsville (Palm Passage), and off Cairns (Grafton Passage). The Great Barrier Reef (GBR) region is frequented by pleasure crafts, sailing vessels, and passenger ships. Pleasure crafts mainly seem to visit the islands and outer reefs, while sailing vessels tend to stay within the GBR lagoon, traversing its length. Passenger ships ferry people to popular reef destinations such as reefs off the Whitsundays, Cairns, and Port Douglas, as well as Heron Island and Lady Musgrave Island. Many large passenger ships, presumably cruise vessels, travel between major ports and international destinations. These ships tend to travel 20 km further offshore than the majority of sailing boats. eAtlas Processing: The following is the processing that was applied to create this derivative dataset. This processing was functionally just a collation of 4 months of data, and a file format change (to GeoPackage) and a trimming of the length of the text attributes (which should not affect their values). Four months of data was used as this was the maximum practical limit of the rendering performance of QGIS and GeoServer. 1. The monthly CTS data was downloaded from https://www.operations.amsa.gov.au/Spatial/DataServices/DigitalData and unzipped. This data was then loaded into QGIS. 2. The `Vector / Data Management Tools / Merge Vector Layers...` tool was used to combine the 4 months of data: Input layers: cts_srr_04_2023_pt, cts_srr_03_2023_pt, cts_srr_02_2023_pt, cts_srr_01_2023_pt Save to GeoPackage: AU_AMSA_Craft-tracking-system_Jan-Apr-2023 Layername: AU_AMSA_Craft-tracking-system_Jan-Apr-2023 3. To reduce the size of the dataset the text attributes were trimmed to the length needed to store the attribute data. `Processing Toolbox > Vector table > Refactor fields` Input layer: AU_AMSA_Craft-tracking-sytem_Jan-Apr-2023 Remove attributes: layer, path (these were created by the Merge Vector Layers tool) Change: Source Expression, Original Length, New Length TYPE, 254, 80 SUBTYPE, 254, 20 TIMESTAMP, 50, 25 Refactored: AU_AMSA_Craft-tracking-system_Jan-Apr-2023_Trim.gpkg Layer name: au_amsa_craft_tracking_system_jan_apr_2023 Data dictionary: - CRAFT_ID: Double Unique identifier for each vessel - LON: Double Longitude in decimal degrees - LAT: Double Latitude in decimal degrees - COURSE: Double Course over ground in decimal degrees - SPEED: Double Speed over ground in knots - TYPE: Text Vessel type NULL 'Cargo ship - All' 'Cargo ship - Carrying DG, HS, or MP, IMO Hazard or pollutant category A' 'Cargo ship - Carrying DG, HS, or MP, IMO Hazard or pollutant category B' 'Cargo ship - Carrying DG, HS, or MP, IMO Hazard or pollutant category C' 'Cargo ship - Carrying DG, HS, or MP, IMO Hazard or pollutant category D' 'Cargo ship - No additional info' 'Cargo ship - Reserved 5' 'Cargo ship - Reserved 6' 'Cargo ship - Reserved 7' 'Cargo ship - Reserved 8' 'Engaged in diving operations' 'Engaged in dredging or underwater operations' 'Engaged in military operations' 'Fishing' 'HSC - All' 'HSC - No additional info' 'HSC - Reserved 7' 'Law enforcement' 'Local 56' 'Local 57' 'Medical transport' 'Other - All' 'Other - Carrying DG, HS, or MP, IMO Hazard or pollutant category A' 'Other - Carrying DG, HS, or MP, IMO Hazard or pollutant category B' 'Other - Carrying DG, HS, or MP, IMO Hazard or pollutant category C' 'Other - No additional info' 'Other - Reserved 5' 'Other - Reserved 6' 'Other - Reserved 7' 'Other - Reserved 8' 'Passenger ship - All' 'Passenger ship - Carrying DG, HS, or MP, IMO Hazard or pollutant category A' 'Passenger ship - Carrying DG, HS, or MP, IMO Hazard or pollutant category B' 'Passenger ship - Carrying DG, HS, or MP, IMO Hazard or pollutant category C' 'Passenger ship - Carrying DG, HS, or MP, IMO Hazard or pollutant category D' 'Passenger ship - No additional info' 'Passenger ship - Reserved 5' 'Passenger ship - Reserved 6' 'Passenger ship - Reserved 7' 'Pilot vessel' 'Pleasure craft' 'Port tender' 'Reserved' 'Reserved - All' 'Reserved - Carrying DG, HS, or MP, IMO Hazard or pollutant category B' 'Reserved - Carrying DG, HS, or MP, IMO Hazard or pollutant category C' 'Reserved - Reserved 6' 'Reserved - Reserved 7' 'Sailing' 'SAR' 'Ship according to RR Resolution No. 18 (Mob-83)' 'Tanker - All' 'Tanker - Carrying DG, HS, or MP, IMO Hazard or pollutant category A' 'Tanker - Carrying DG, HS, or MP, IMO Hazard or pollutant category B' 'Tanker - Carrying DG, HS, or MP, IMO Hazard or pollutant category C' 'Tanker - Carrying DG, HS, or MP, IMO Hazard or pollutant category D' 'Tanker - No additional info' 'Tanker - Reserved 5' 'Tanker - Reserved 6' 'Tanker - Reserved 7' 'Tanker - Reserved 8' 'Towing' 'Towing Long/Large' 'Tug' 'unknown code 0' 'unknown code 1' 'unknown code 100' 'unknown code 104' 'unknown code 106' 'unknown code 111' 'unknown code 117' 'unknown code 123' 'unknown code 125' 'unknown code 140' 'unknown code 150' 'unknown code 158' 'unknown code 2' 'unknown code 200' 'unknown code 207' 'unknown code 209' 'unknown code 223''unknown code 230' 'unknown code 253' 'unknown code 255' 'unknown code 4' 'unknown code 5' 'unknown code 6''unknown code 9' 'Vessel with anti-pollution facilities or equipment' 'WIG - All' 'WIG - Carrying DG, HS, or MP, IMO Hazard or pollutant category A' 'WIG - Carrying DG, HS, or MP, IMO Hazard or pollutant category B' 'WIG - Carrying DG, HS, or MP, IMO Hazard or pollutant category C' 'WIG - No additional info' 'WIG - Reserved 6' 'WIG - Reserved 7' - SUBTYPE: Text Vessel sub-type NULL 'Fishing Vessel' 'Powerboat' - LENGTH: Short integer Vessel length in metres - BEAM: Short integer Vessel beam in metres - DRAUGHT: Double Draught of the vessel, in metres. - TIMESTAMP: Text Vessel position report UTC timestamp in dd/mm/yyyy hh:mm:ss AM/PM format eAtlas notes: Fishing vessels are encoded as, TYPE: Fishing or TYPE: NULL, SUBTYPE: Fishing Vessel or TYPE: unknown code X. A lot of the vessels with and unknown code appeared to be predominately fishing vessels based on their behaviour. Location of the data: This dataset is filed in the eAtlas enduring data repository at: data\\non-custodian\ongoing\AU_AMSA_Craft-tracking-system
-
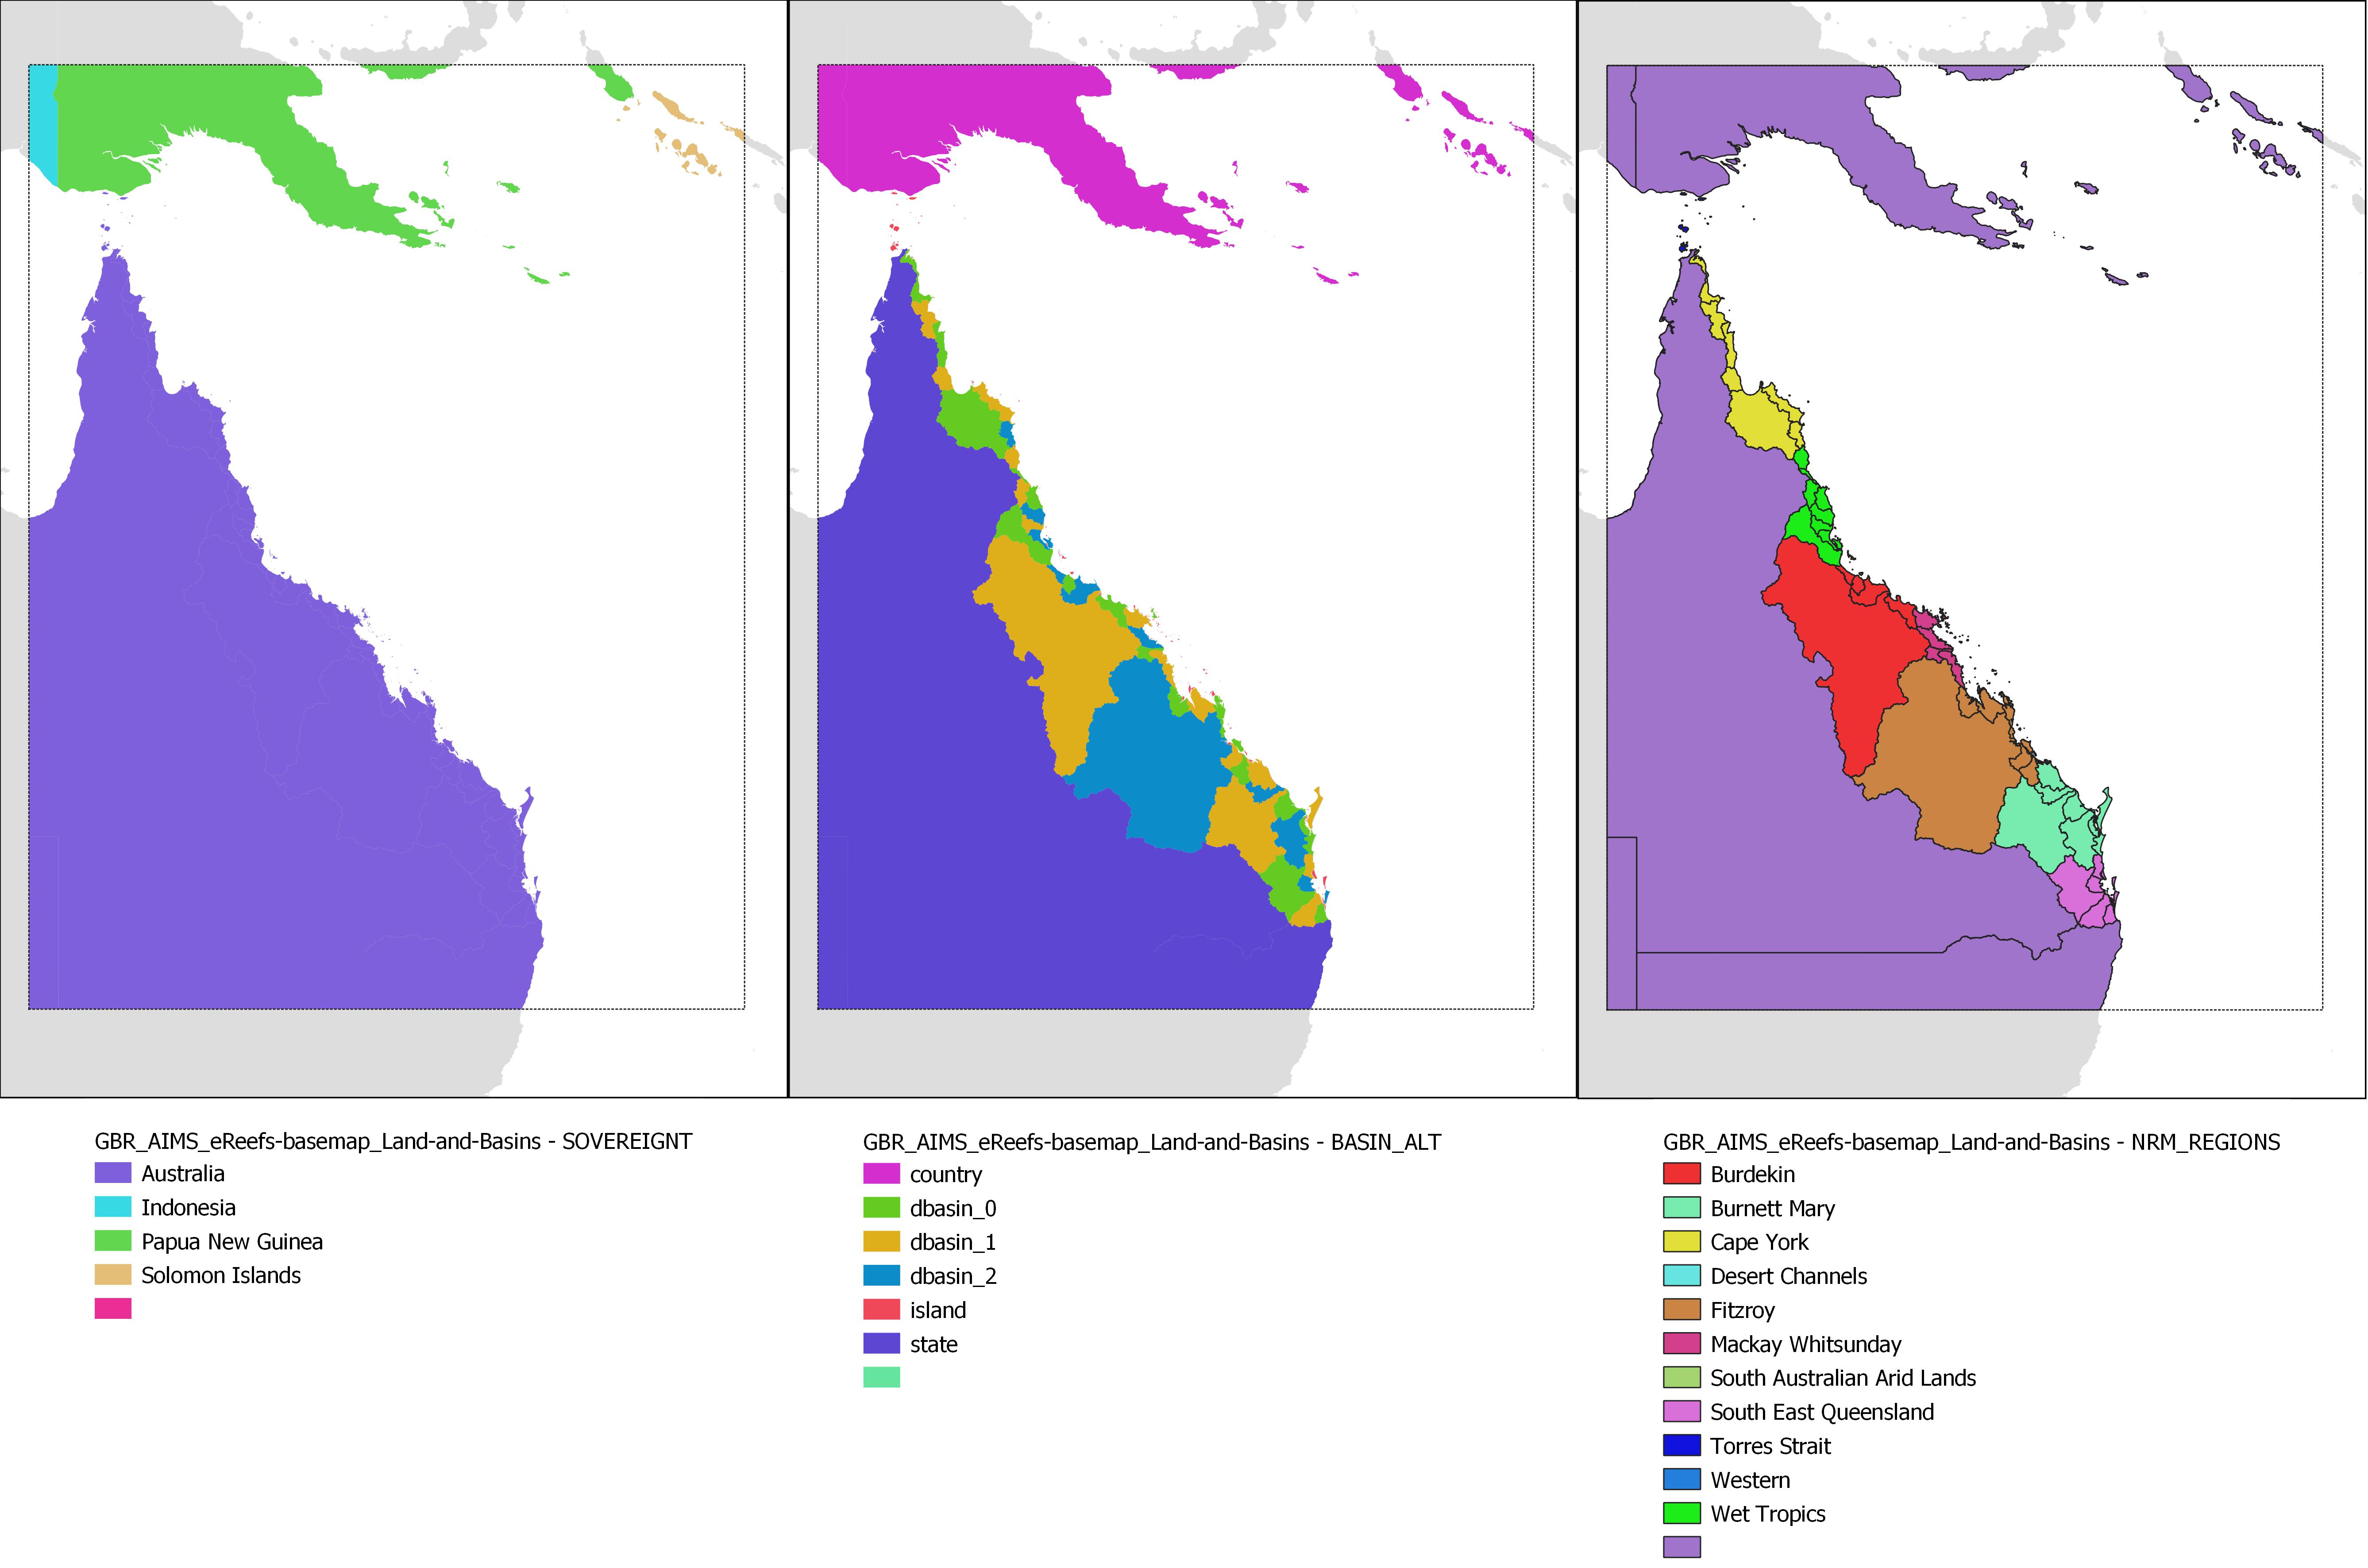
This dataset collection contains GIS layers for creating the AIMS eReefs visualisation maps (https://ereefs.aims.gov.au/). These datasets are useful for creating A4 printed maps of the Great Barrier Reef and the Coral Sea. It contains the following datasets: - Countries - Australia plus surrounding countries at 1:10M scale. Crop of Natural Earth Data 1:10 Admin 0 - Countries dataset. Allows filtering out of surrounding countries. - Cities - 21 Cities along the Queensland coastline. - Basins - Drainage basins adjacent to the Great Barrier Reef along the eastern Queensland coastline. Derived from Geoscience Australia River Basins 1997 dataset. It is a subset and reprojection. - Land and Basins - This layer contains both Queensland and PNG land areas, along with the river basins along the eastern Queensland coastline. This is an integrated layer that represents both the background land area and the river basins all in one layer. This layer saves having to map the land area, then overlay the river basins. In this way each polygon only needs to be rendered once. The goal of this layer is to optmise the rendering time of the eReefs base map. This dataset is made up from the Geoscience Australia Australia's River Basins 1997 dataset for the Queensland coastline and the eastern Queensland basins. PNG is copied from Natural Earth Data 10 m countries dataset. - Rivers - Rivers that drain along the Queensland eastern coast. This is a subset of the Geoscience Australia Geodata Topo 1:5M 2004. - Reefs - Boundaries of reefs in GBR, Torres Strait and Coral Sea. In the Coral Sea it contains the atoll platform boundaries rather than the individual reefs. This is derived from the GBRMPA GBR features dataset, AIMS Torres Strait features dataset and the AIMS Coral Sea features dataset. These were combined and simplified to a scale of 1:1M. Note that this simplification resulted in multiple neighbouring reefs being grouped together. This dataset is intended for visual rendering of maps. - Clip regions - Polygons for clipping eReefs data to the GBR. Also contains approximate polygons for Coral Sea, Torres Strait, PNG and New Caledonia. This was created principally for setting the region attribute for the Reefs dataset, but was made available as it is useful for clipping eReefs data to the GBR for plotting purposes. Methods: Most of the base map layers are derived from a variety of data sources. The full workflow used to transform these source datasets is documented on GitHub (https://github.com/eatlas/GBR_AIMS_eReefs-basemap). Limitations of the data: The datasets in this collection have been cropped and simplified for the purposes of creating low detail printed maps of the GBR. They are not intended for creating a high resolution base map. Format of the data: Shapefile and GeoJSON files. The Cities dataset is provided as a CSV file. Location of the data: This dataset is filed in the eAtlas enduring data repository at: data\custodian\2018-2024-eReefs\GBR_AIMS_eReefs-basemap
-
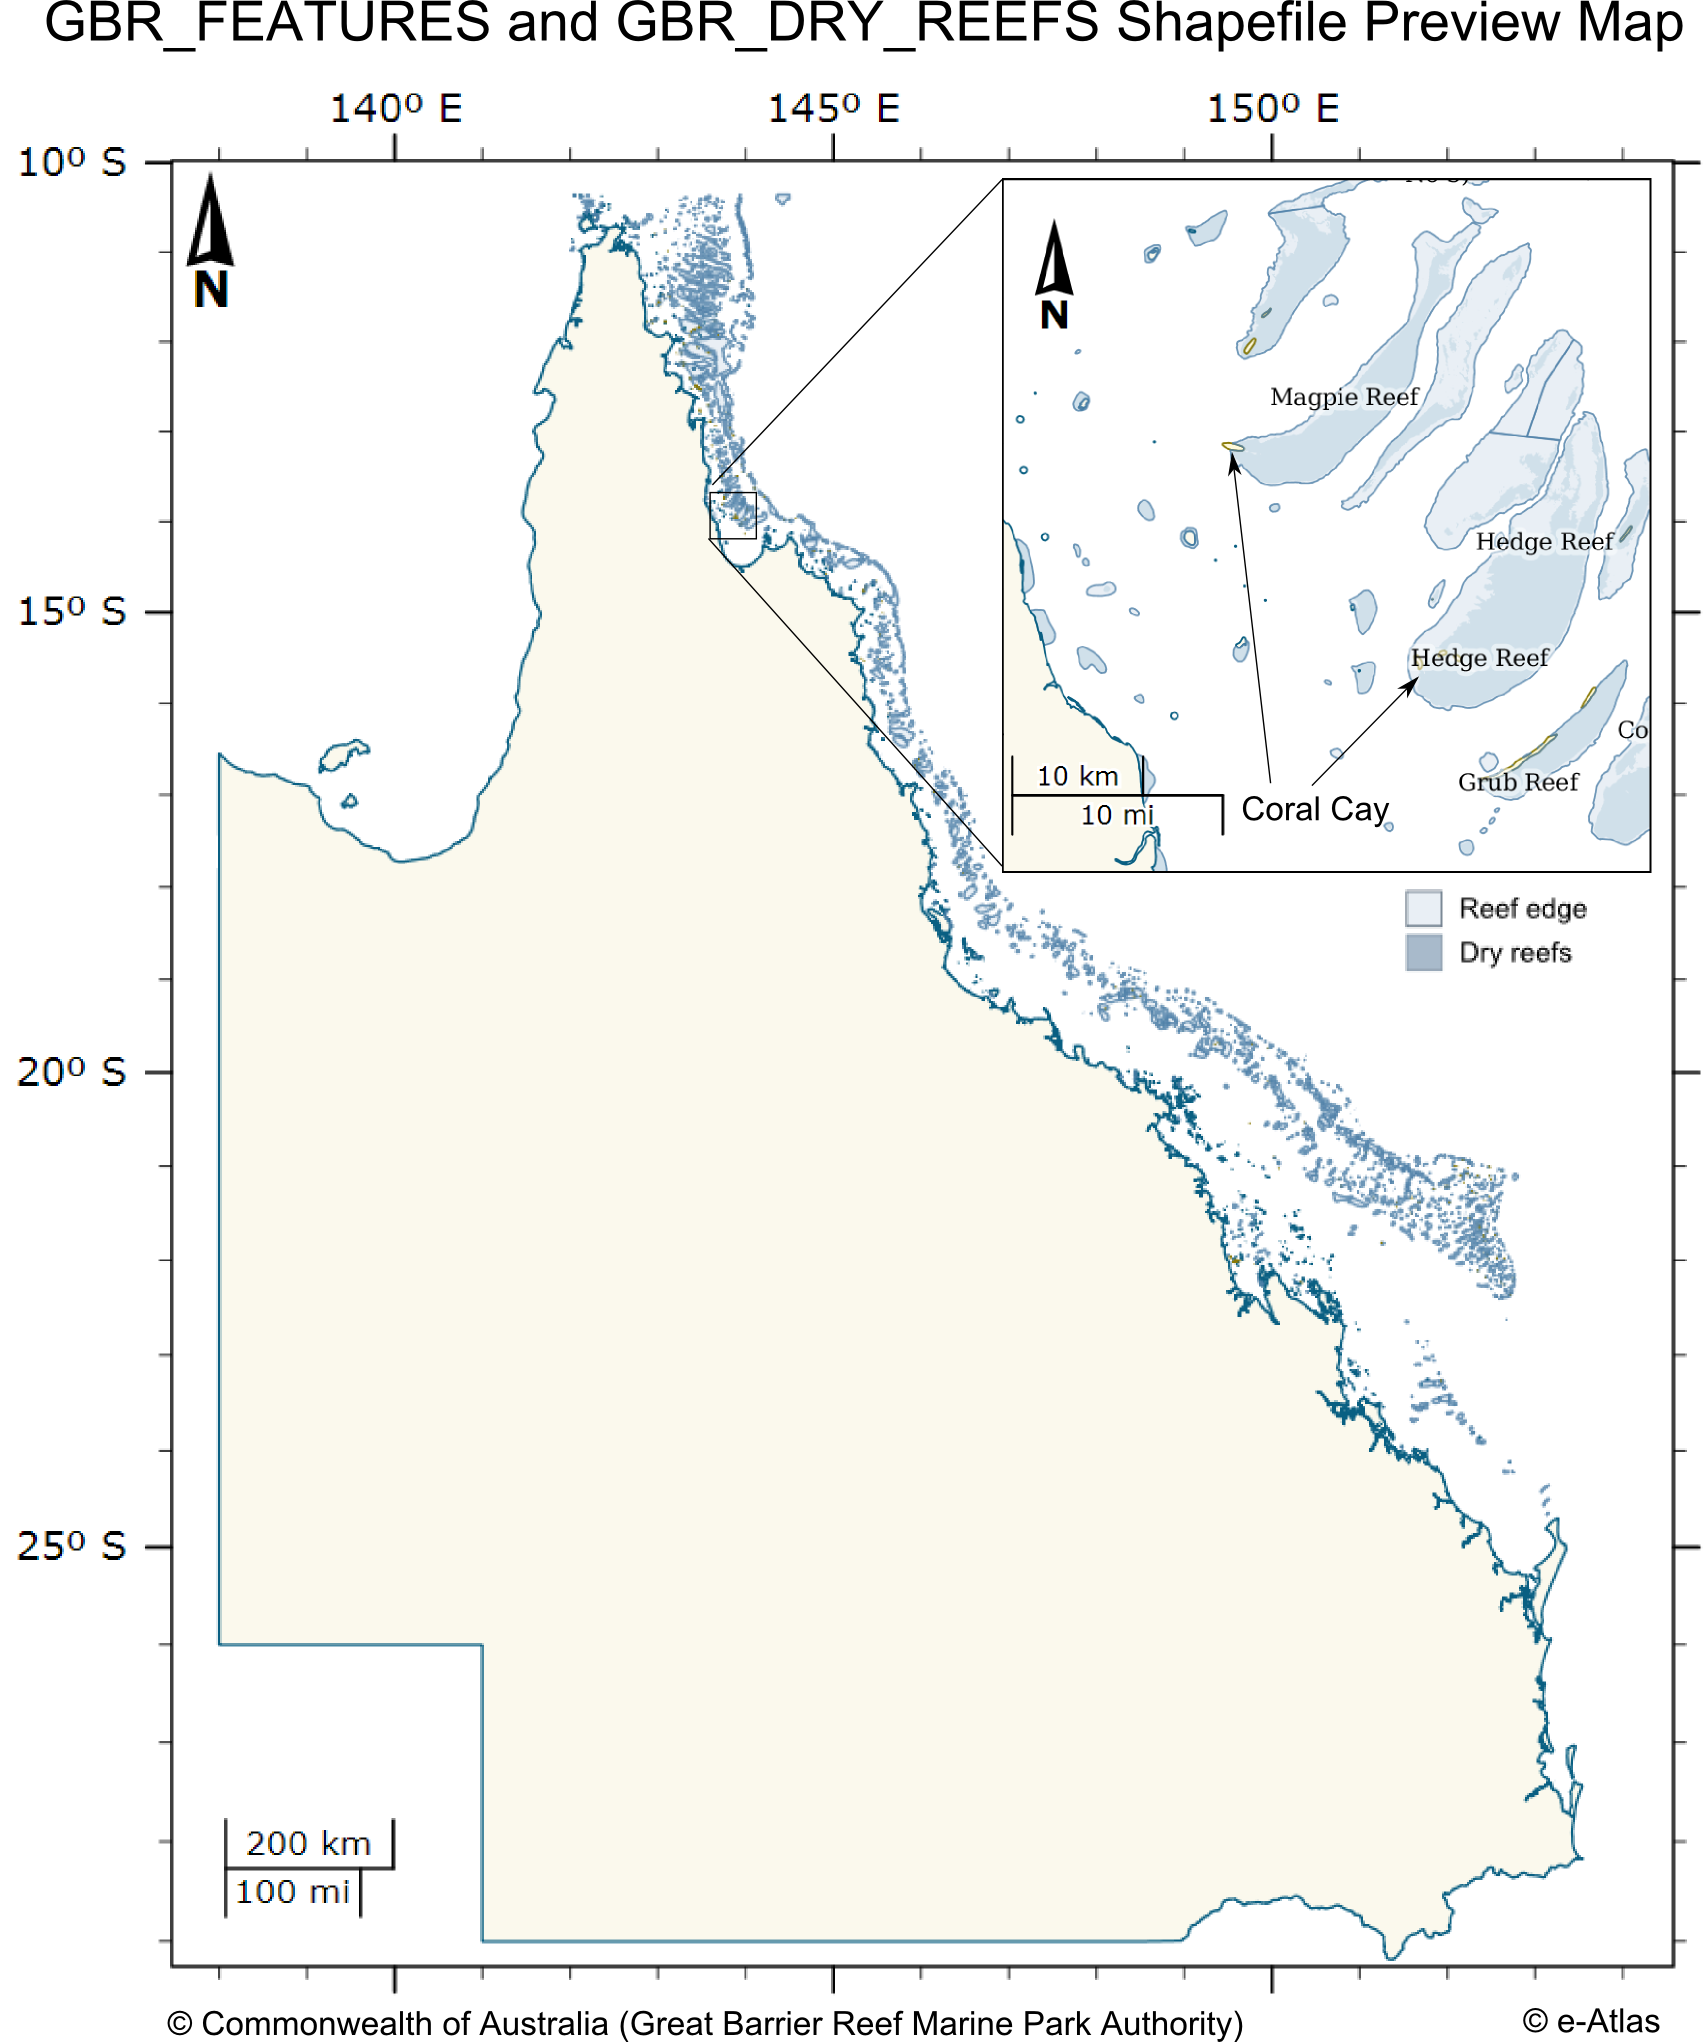
This dataset contains coastal features within and adjacent to the Great Barrier Reef World Heritage area. This dataset consists of two shapefiles GBR_FEATURES.shp and GBR_DRY_REEF.shp. The GBR_FEATURES shapefile contains the following features: * Queensland mainland coastline, * Major and other coral reef structures (as defined by the reef shoal edge), * Islands and rocks (exposed and submerged), * Major coral cay features. The GBR_DRY_REEFS contains major coral reef structures (as defined by the reef shoal edge) that are tidal, drying or emergent reef areas. The reef features extend north above the GBRWHA to just within the Torres Strait region. The features have not been statistically tested with precision survey techniques. Positional accuracy varies considerably and dataset should NOT be used for navigation purposes, however, for general use the coverage can be regarded as having a nominal scale of 1:250,000. This dataset corresponds to the zoning within the Great Barrier Reef Marine Park effective 1st July 2004. It is derived from the Great Barrier Reef Marine Park Zoning Plan 2003. The Great Barrier Reef Marine Park is a multiple-use area. Zoning helps to manage and protect the values of the Marine Park that users enjoy. Zoning Plans define what activities occur in which locations both to protect the marine environment and to separate potentially conflicting activities. Revised zoning of the Great Barrier Reef Marine Park was introduced in July 2004 as part of the Great Barrier Reef Marine Park Authority's Representative Areas Programme. Between 1999 and 2004, the Great Barrier Reef Marine Park Authority undertook a systematic planning and consultative program to develop new zoning for the Marine Park. The primary aim of the program was to better protect the range of biodiversity in the Great Barrier Reef, by increasing the extent of no-take areas (or highly protected areas, locally known as ‘Green Zones’), ensuring they included 'representative' examples of all different habitat types - hence the name, the Representative Areas Program or RAP. Whilst increasing the protection of biodiversity, a further aim was to maximise the benefits and minimise the negative impacts of the rezoning on the existing users of the Marine Park. Both these aims were achieved by a comprehensive program of scientific input, community involvement and innovation [1]. In each zones there are a range of activities that are allowed, disallowed or require a permit. The following outlines a summary of activities that are disallowed in each zone. Please refer to [2] for a more detailed and authoritative description of all restrictions within each zone: * General Use Zone: General use, some activities require a permit. * Habitat Protection Zone: No trawling, some activities require permits. * Conservation Park Zone: No trawling, limited crabbing and line fishing. * Buffer Zone: No aquaculture, bait netting, crabbing, harvesting fishing, collecting, spearfishing, line fishing, netting and trawling. Trolling for pelagic fish is allowed. * Scientific Research Zone: Research areas primarily around scientific research facilities. Same as Buffer zone but with no trolling. * Marine National Park Zone (Green): 'no-take' area. The following are allowed: boating, diving, photography and limited impact research. Some other activities are allowed with permits. * Preservation Zone (Pink): 'no go' area. No activities are allowed except research activities with a permit. Official maps derived from this dataset can be downloaded from the GBRMPA Zoning Maps [3] page. This dataset can now be downloaded directly from GBRMPA's Geoportal. Note: This metadata record was created for the eAtlas and is not authoritative. Please contact GBRMPA for more information. GBR_FEATURES.shp: Polygon Vector Shape file (5376 features) GBR_ID: A number that is made up of a two-digit number representing the latitude band the feature is in (LAT_ID) and a three or four-digit number representing the sequential number of a particular feature complex (GROUP_ID), e.g. an island with an adjacent reef/cay/rock etc should have the same GROUP_ID (19-051) SORT_GBR_I: A whole number for sorting (19051) GBR_NAME: Great Barrier Reef MP Name (Five Trees Cay (No 1)) QLD_NAME: Queensland Name (Five Trees Cay (No 1)) FEATURE_C: a three-digit number representing the type of feature, e,g mainland, island, cay etc (102) FEAT_NAME: Name of feature (Cay, Island, Mainland, Reef, Rock, Sand) SUB_NO: a two-digit number that is linked to the SUB_ID of a feature. The SUB_ID is a letter that identifies multiple features of the same type in a group, e.g. multiple reefs surrounding an island are labelled a, b, c, d etc - these will be numbered 101, 102, 103, 104 etc. If the SUB_ID is "s", it refers to a single feature and will be given the number 100 (101) LABEL_ID: GBR_ID plus SUB_ID if not an S (S is a singular feature and does not need a sub-id label) (19-051a) X_COORD: Centroid of feature (in Geographics GDA94 decimal degrees) (150.221849) Y_COORD: Centroid of feature (in Geographics GDA94 decimal degrees) (-22.227123) CODE: GBR_ID plus SUB_NO plus FEATURE_CODE with hyphens (19-051-101-102) UNIQUE_ID: GBR_ID plus SUB_NO plus FEATURE_CODE with no hyphens. This is to be used as the unique ID for the oracle database (19051102101) GBR_DRY_REEFS.shp: This shows areas of the reef that dry or the tops of the reefs. Polygon Vector Shape file (2318 features)