 eAtlas Data Catalogue
imageryBaseMapsEarthCover
Type of resources
Topics
Keywords
Contact for the resource
Provided by
Years
Formats
Representation types
Update frequencies
status
Scale
-
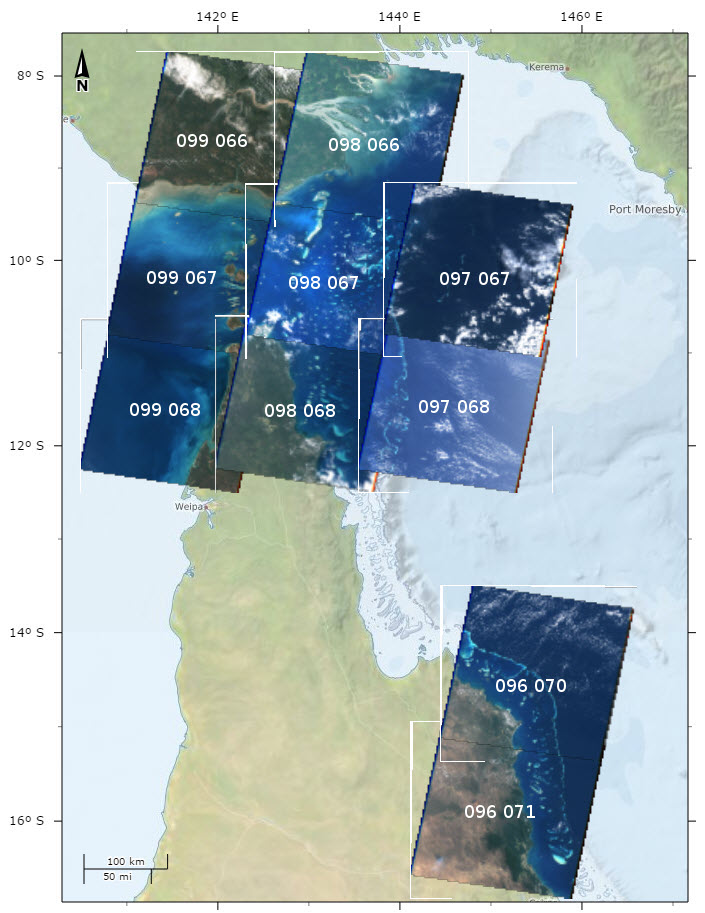
This dataset contains Landsat 5 imagery for selected areas of Queensland, currently Torres Strait and around Lizard Island and Cape Tribulation. This collection was made as a result of the development of the Torres Strait Features dataset. It includes a number (typically 4 - 8) of selected Landsat images for each scene from the entire Landsat 5 archive. These images were selected for having low cloud cover and clear water. The aim of this collection was to allow investigation of the marine features. The complete catalogue of Landsat 5 for scenes 96_70, 96_71, 97_67, 97_68, 98_66, 98_67, 98_68_99_66, 99_67 and 99_68 were downloaded from the Google Earth Engine site ( https://console.developers.google.com/storage/earthengine-public/landsat/ ). The images were then processed into low resolution true colour using GDAL. They were then reviewed for picture clarity and the best ones were selected and processed at full resolution to be part of this collection. The true colour conversion was achieved by applying level adjustment to each channel to ensure that the tonal scaling of each channel was adjusted to give a good overall colour balance. This effectively set the black point of the channel and the gain. This adjustment was applied consistently to all images. - Red: Channel B3, Black level 8, White level 58 - Green: Channel B2, Black level 10, White level 55 - Blue: Channel B1, Black level 32, White level 121 Note: A constant level adjustment was made to the images regardless of the time of the year that the images were taken. As a result images in the summer tend to be brighter than those in the winter. After level adjustment the three channels were merged into a single colour image using gdal_merge. The black surround on the image was then made transparent using the GDAL nearblack command. This collection consists of 59 images saved as 4 channel (Red, Green, Blue, Alpha) GeoTiff images with LZW compression (lossless) and internal overviews with a WGS 84 UTM 54N projection. Each of the individual images can be downloaded from the eAtlas map client (Overlay layers: eAtlas/Imagery Base Maps Earth Cover/Landsat 5) or as a collection of all images for each scene. Data Location: This dataset is filed in the eAtlas enduring data repository at: data\NERP-TE\13.1_eAtlas\QLD_NERP-TE-13-1_eAtlas_Landsat-5_1988-2011
-
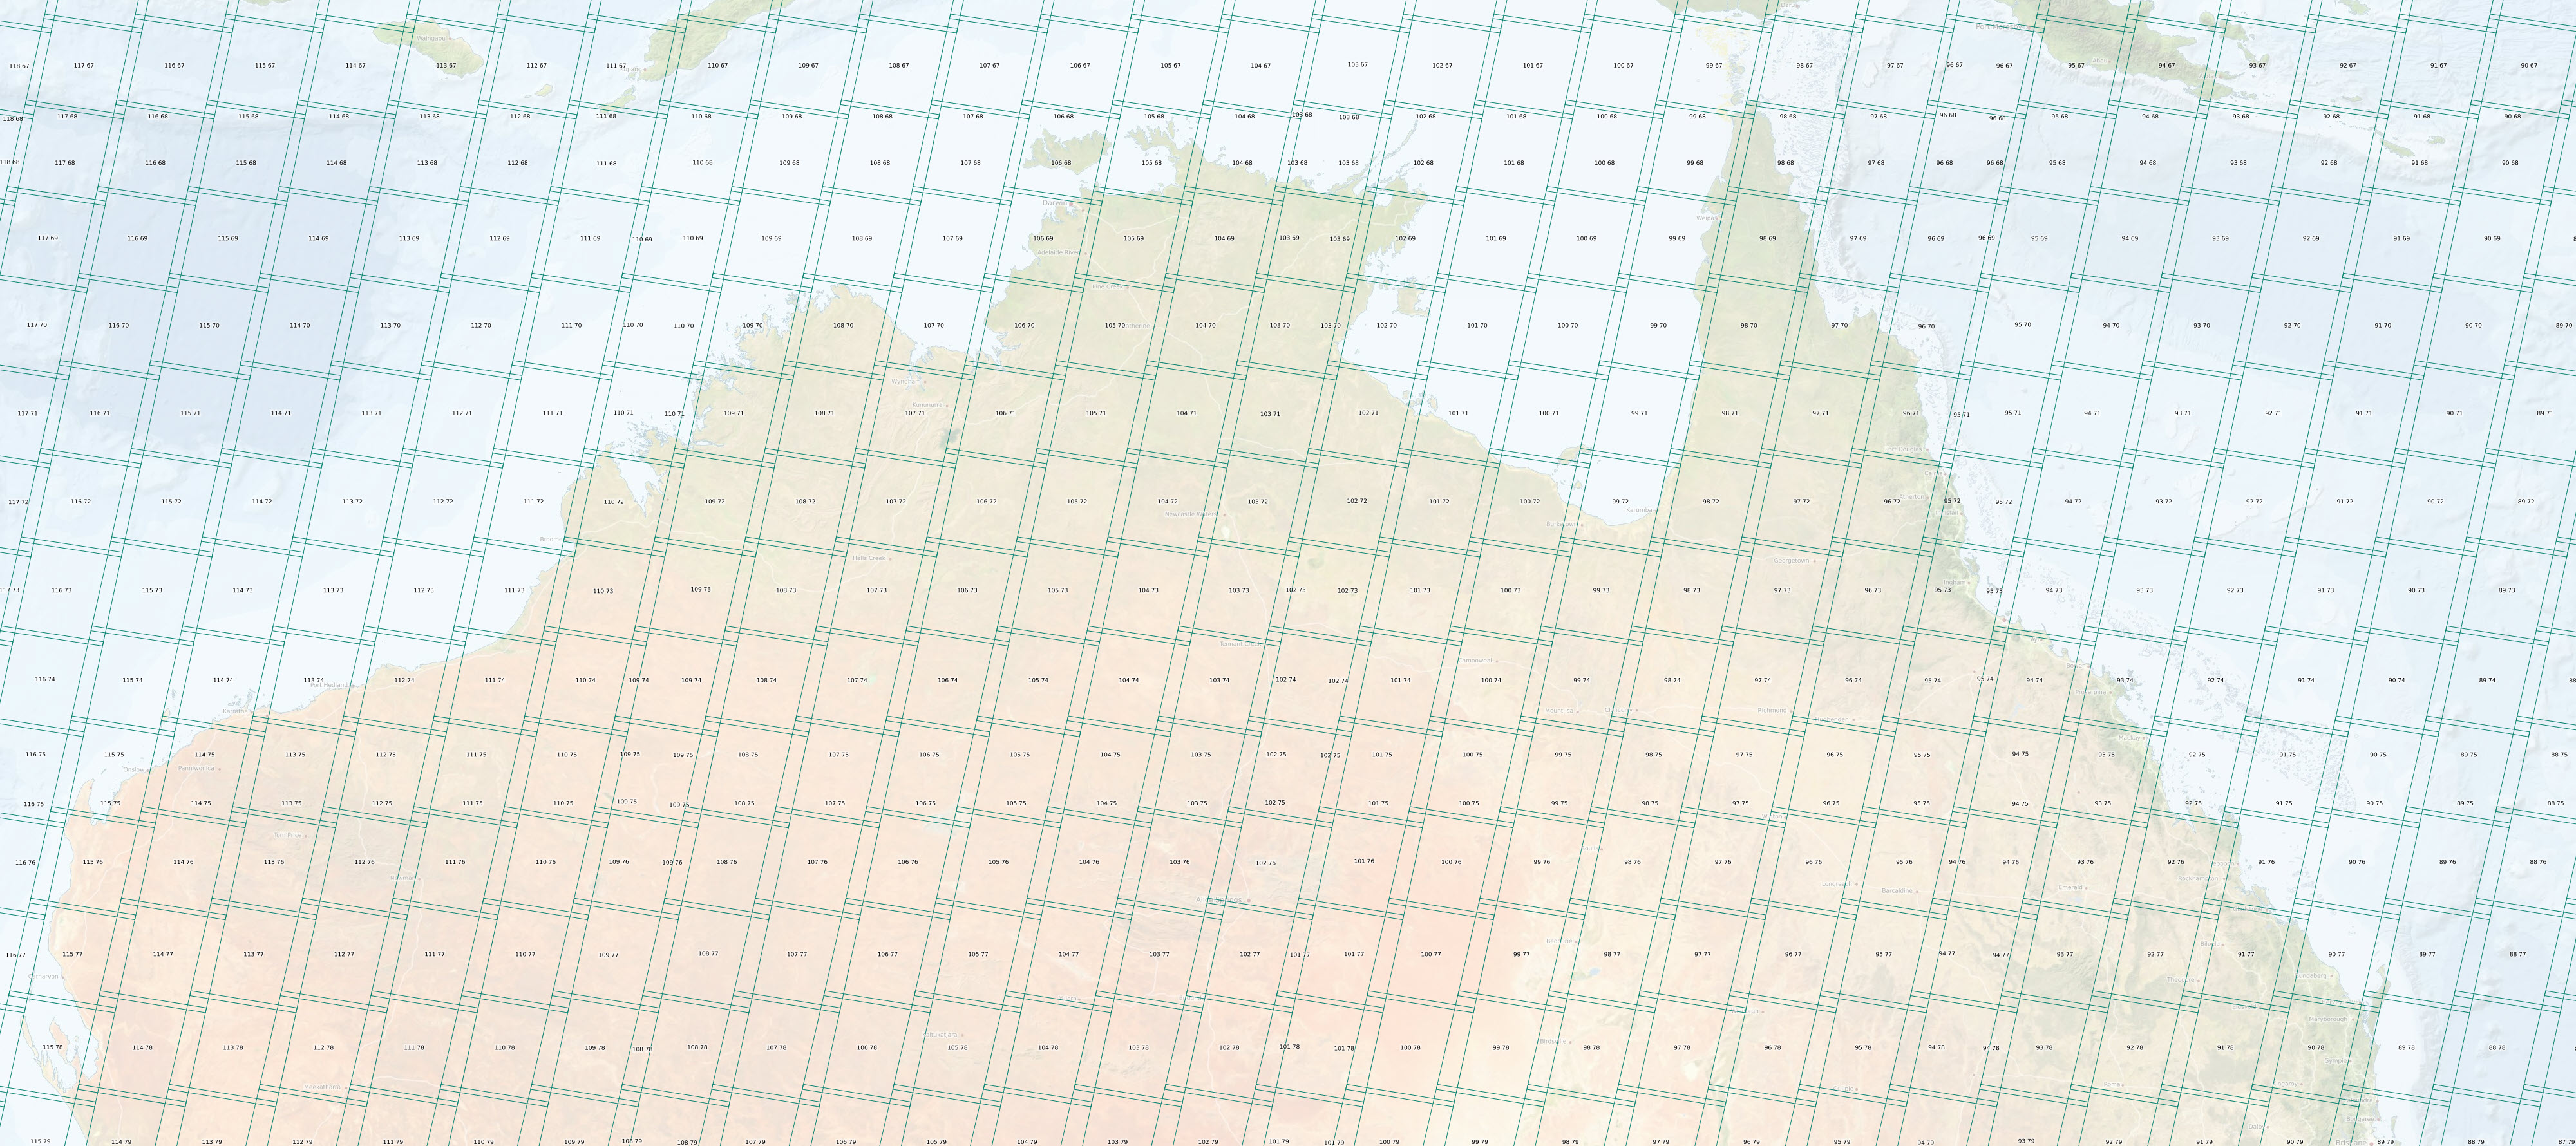
This dataset shows the tiling grid and their Row and Path IDs for Landsat 4 - 9 satellite imagery. The IDs are useful for selecting imagery of an area of interest. Landsat 4 - 9 are a series of Earth observation satellites, part of the US Landsat program aimed at monitoring Earth's land surfaces since 1982. The Worldwide Reference System (WRS) is a global notation system used for cataloging and indexing Landsat imagery. It employs a grid-based system consisting of path and row numbers, where the path indicates the longitude and the row indicates the latitude, allowing users to easily locate and identify specific scenes covering a particular area on Earth. Landsat satellites 4,5,7, 8, and 9 follow WRS-2 which this dataset describes. This dataset corresponds to the descending Path Row identifiers as these correspond to day time scenes. eAtlas Notes: It should be noted that the extent boundaries of the scene polygons in this dataset are only indicative of the imagery extent. For Landsat 5 images the individual images move around by about 10 km and the shape of the Landsat 8 and 9 images do not match the shape of the WRS-2 polygons. The angle of the top and bottom edges are at a different angle to the imagery, where the imagery is more square in shape. The left and right edges of the polygons are also smaller than the imagery. As a result of this, this dataset is probably not suitable as a clipping mask for the imagery for these satellites. This dataset is suitable for determining the approximate extent of the imagery and the associated Row and Path IDs for a given scene. Why is this dataset in the eAtlas?: Landsat imagery is very useful for the studying and mapping of reef systems. Selecting imagery for study often requires knowing the Path and Row numbers for the area of interest. This dataset is intended as a reference layer. This metadata is included to link to from the associated mapping layer. The eAtlas is not the custodian of this dataset and copies of the data should be obtained from the original sources. The eAtlas does however keep a cached version of the dataset from the time this dataset was setup to make available should the original dataset no longer become available. eAtlas Processing: The original data was sourced from USGS (See links). No modifications to the underlying data were performed. Location of the data: This dataset is filed in the eAtlas enduring data repository at: data\\non-custodian\2020-2024\World_USGS_Landsat-WRS-2
-
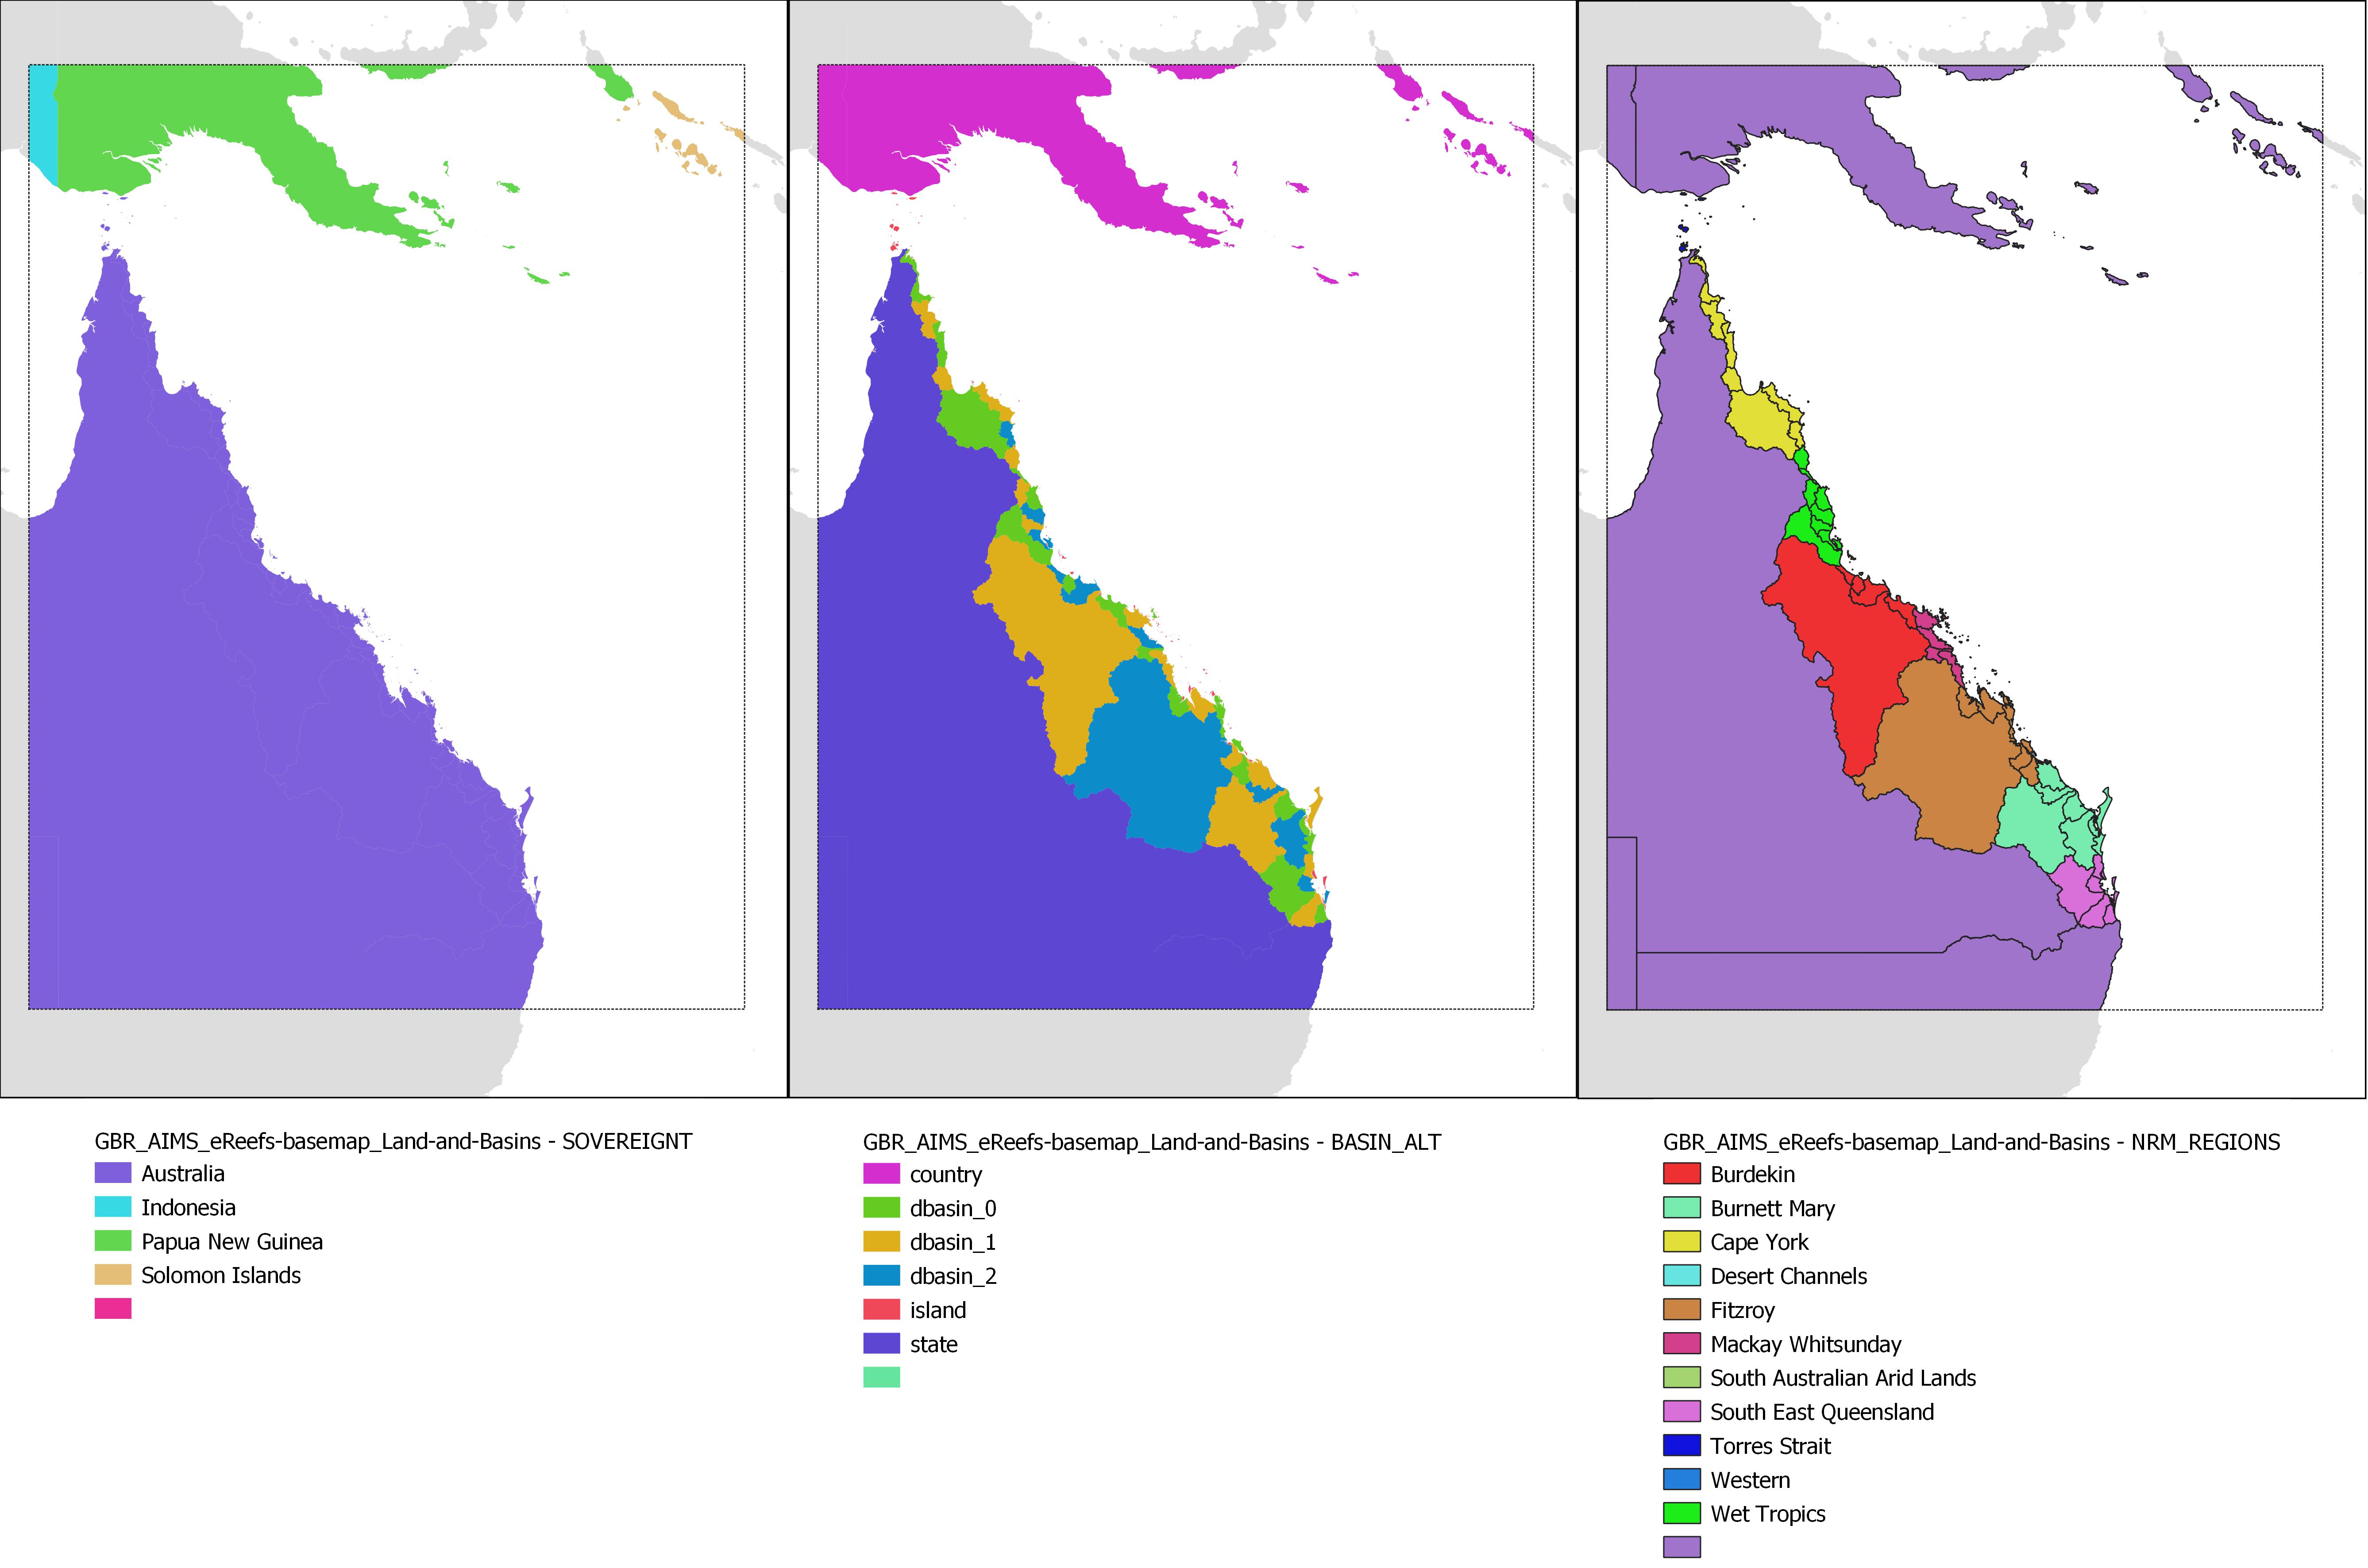
This dataset collection contains GIS layers for creating the AIMS eReefs visualisation maps (https://ereefs.aims.gov.au/). These datasets are useful for creating A4 printed maps of the Great Barrier Reef and the Coral Sea. It contains the following datasets: - Countries - Australia plus surrounding countries at 1:10M scale. Crop of Natural Earth Data 1:10 Admin 0 - Countries dataset. Allows filtering out of surrounding countries. - Cities - 21 Cities along the Queensland coastline. - Basins - Drainage basins adjacent to the Great Barrier Reef along the eastern Queensland coastline. Derived from Geoscience Australia River Basins 1997 dataset. It is a subset and reprojection. - Land and Basins - This layer contains both Queensland and PNG land areas, along with the river basins along the eastern Queensland coastline. This is an integrated layer that represents both the background land area and the river basins all in one layer. This layer saves having to map the land area, then overlay the river basins. In this way each polygon only needs to be rendered once. The goal of this layer is to optmise the rendering time of the eReefs base map. This dataset is made up from the Geoscience Australia Australia's River Basins 1997 dataset for the Queensland coastline and the eastern Queensland basins. PNG is copied from Natural Earth Data 10 m countries dataset. - Rivers - Rivers that drain along the Queensland eastern coast. This is a subset of the Geoscience Australia Geodata Topo 1:5M 2004. - Reefs - Boundaries of reefs in GBR, Torres Strait and Coral Sea. In the Coral Sea it contains the atoll platform boundaries rather than the individual reefs. This is derived from the GBRMPA GBR features dataset, AIMS Torres Strait features dataset and the AIMS Coral Sea features dataset. These were combined and simplified to a scale of 1:1M. Note that this simplification resulted in multiple neighbouring reefs being grouped together. This dataset is intended for visual rendering of maps. - Clip regions - Polygons for clipping eReefs data to the GBR. Also contains approximate polygons for Coral Sea, Torres Strait, PNG and New Caledonia. This was created principally for setting the region attribute for the Reefs dataset, but was made available as it is useful for clipping eReefs data to the GBR for plotting purposes. Methods: Most of the base map layers are derived from a variety of data sources. The full workflow used to transform these source datasets is documented on GitHub (https://github.com/eatlas/GBR_AIMS_eReefs-basemap). Limitations of the data: The datasets in this collection have been cropped and simplified for the purposes of creating low detail printed maps of the GBR. They are not intended for creating a high resolution base map. Format of the data: Shapefile and GeoJSON files. The Cities dataset is provided as a CSV file. Location of the data: This dataset is filed in the eAtlas enduring data repository at: data\custodian\2018-2024-eReefs\GBR_AIMS_eReefs-basemap
-
This dataset is a composite of Landsat 5 satellite imagery to produce a cloud free, clear water seamless image of the Torres Strait region. This image includes some of Cape York and PNG, in particular the Fly river. This composite shows clear imagery for marine areas, in particular reefs, larger islands and sand bars. This image has a resolution of approximately 30 m and a positional accuracy of better than 50 m. There is a new similar dataset based on higher resolution Sentinel 2 imagery: Lawrey, E. (2022). Torres Strait Sentinel 2 Satellite Regional Maps and Imagery 2015 – 2021 (AIMS) [Data set]. eAtlas. https://doi.org/10.26274/3CGE-NV85 This composite is made from 8 Landsat scenes. Images in each scene were selected by trawling through the entire archive of Landsat 5 to find the clearest two to three clearest images. The preference for these images was that they needed to be as cloud free as possible, be at low tide and for the water to be as clear as possible. The final images used range from 1993 - 2009. The selected images were converted to true colour, corrected for sun glint, high level thin clouds and haze. The two or three images for a scene were then blended together in Photoshop using feathered masks to remove clouded areas. The images were then colour and tonally corrected to match neighbouring scenes. The scenes were then blended by copying cropped feathered versions of the neighbouring scenes. The resulting images for each scene were then masked to create a clean "no data" boundary around the image so that mosaicking would not introduce any visual artefacts. The scene images were then mosaicked together into a single image using gdalwarp. The final image was then reprojected using gdalwarp and finally trimmed and compressed using gdal_translate.
-
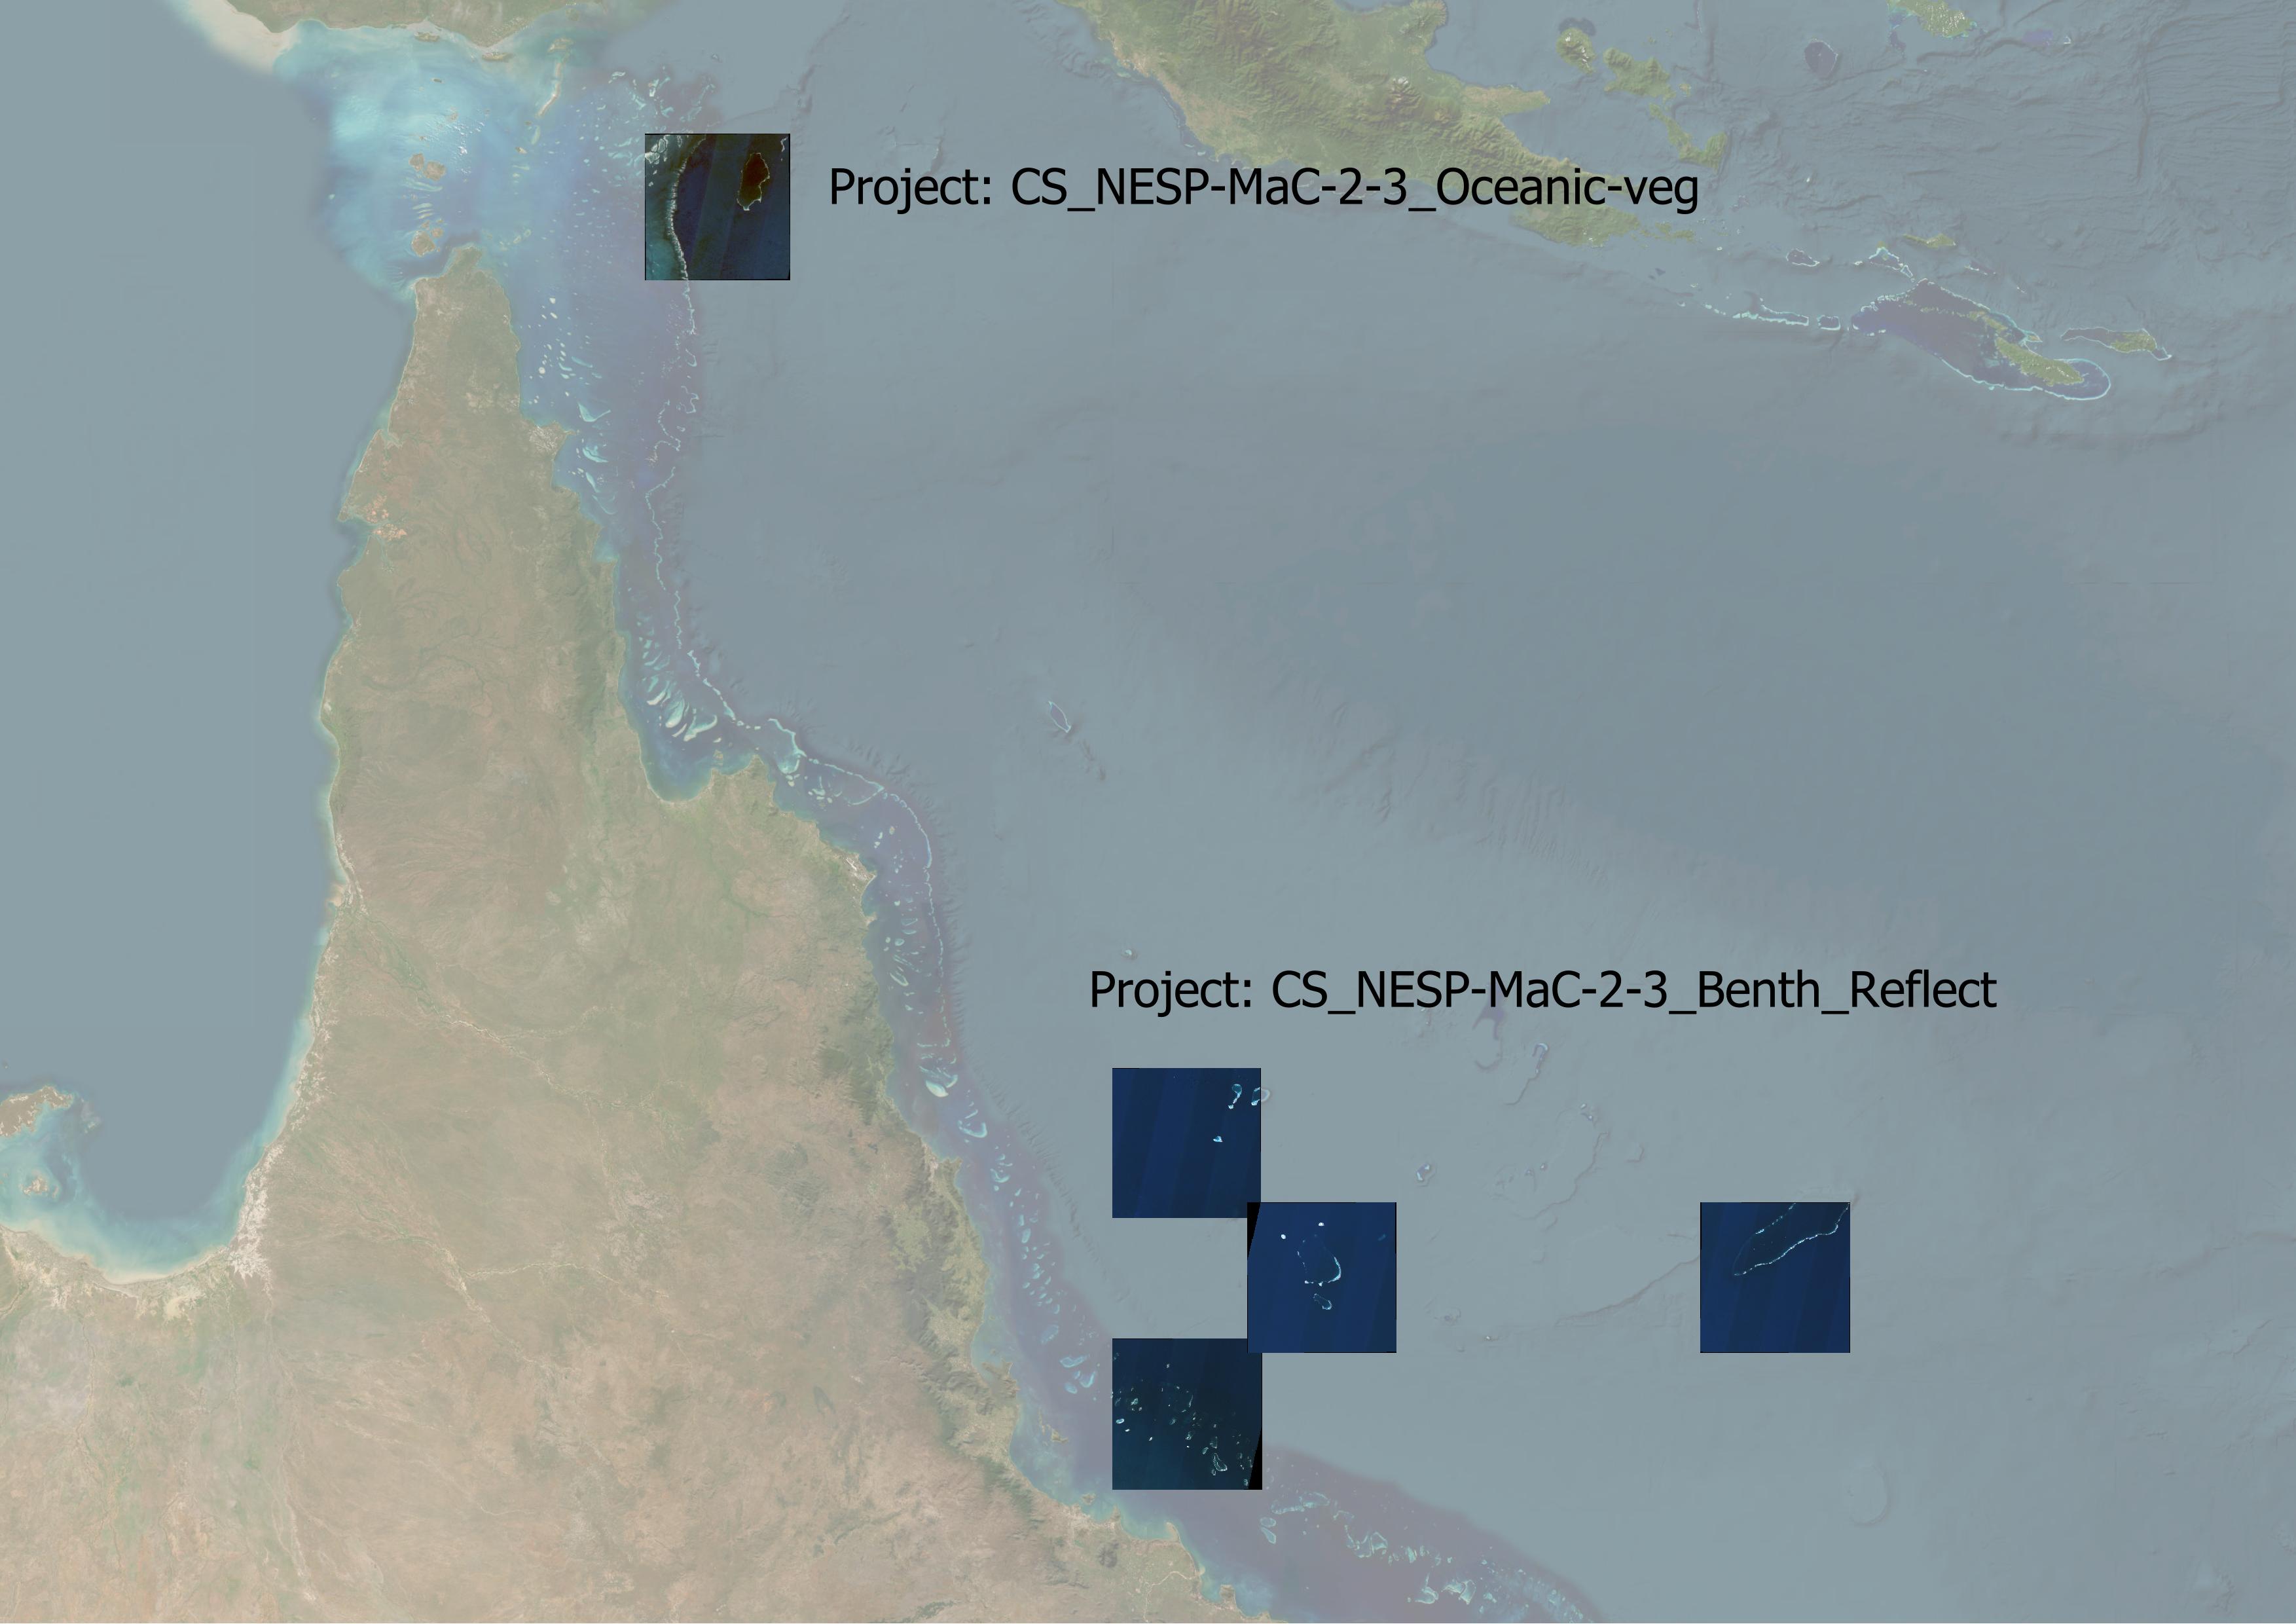
This dataset consists of collections of satellite image composites (Sentinel 2 and Landsat 8) that are created from manually curated image dates for a range of projects. These images are typically prepared for subsequent analysis or testing of analysis algorithms as part of other projects. This dataset acts as a repository of reproducible test sets of images processed from Google Earth Engine using a standardised workflow. Details of the algorithms used to produce the imagery are described in the GEE code and code repository available on GitHub (https://github.com/eatlas/World_AIMS_Marine-satellite-imagery). Project test image sets: As new projects are added to this dataset, their details will be described here: - NESP MaC 2.3 Benthic reflection estimation (projects/CS_NESP-MaC-2-3_AIMS_Benth-reflect): This collection consists of six Sentinel 2 image composites in the Coral Sea and GBR for the purpose of testing a method of determining benthic reflectance of deep lagoonal areas of coral atolls. These image composites are in GeoTiff format, using 16-bit encoding and LZW compression. These images do not have internal image pyramids to save on space. [Status: final and available for download] - NESP MaC 2.3 Oceanic Vegetation (projects/CS_NESP-MaC-2-3_AIMS_Oceanic-veg): This project is focused on mapping vegetation on the bottom of coral atolls in the Coral Sea. This collection consists of additional images of Ashmore Reef. The lagoonal area of Ashmore has low visibility due to coloured dissolved organic matter, making it very hard to distinguish areas that are covered in vegetation. These images were manually curated to best show the vegetation. While these are the best images in the Sentinel 2 series up to 2023, they are still not very good. Probably 80 - 90% of the lagoonal benthos is not visible. [Status: final and available for download] - NESP MaC 3.17 Australian reef mapping (projects/AU_NESP-MaC-3-17_AIMS_Reef-mapping): This collection of test images was prepared to determine if creating a composite from manually curated image dates (corresponding to images with the clearest water) would produce a better composite than a fully automated composite based on cloud filtering. The automated composites are described in https://doi.org/10.26274/HD2Z-KM55. This test set also includes composites from low tide imagery. The images in this collection are not yet available for download as the collection of images that will be used in the analysis has not been finalised. [Status: under development, code is available, but not rendered images] - Default (project/default): This collection of manual selected scenes are those that were prepared for the Coral Sea and global areas to test the algorithms used in the developing of the original Google Earth Engine workflow. This can be a good starting point for new test sets. Note that the images described in the default project are not rendered and made available for download to save on storage space. [Status: for reference, code is available, but not rendered images] Filename conventions: The images in this dataset are all named using a naming convention. An example file name is `Wld_AIMS_Marine-sat-img_S2_NoSGC_Raw-B1-B4_54LZP.tif`. The name is made up of: - Dataset name (`Wld_AIMS_Marine-sat-img`), short for World, Australian Institute of Marine Science, Marine Satellite Imagery. - Satellite source: `L8` for Landsat 8 or `S2` for Sentinel 2. - Additional information or purpose: `NoSGC` - No sun glint correction, `R1` best reference imagery set or `R2` second reference imagery. - Colour and contrast enhancement applied (`DeepFalse`, `TrueColour`,`Shallow`,`Depth5m`,`Depth10m`,`Depth20m`,`Raw-B1-B4`), - Image tile (example: Sentinel 2 `54LZP`, Landsat 8 `091086`) Limitations: Only simple atmospheric correction is applied to land areas and as a result the imagery only approximates the bottom of atmosphere reflectance. For the sentinel 2 imagery the sun glint correction algorithm transitions between different correction levels from deep water (B8) to shallow water (B11) and a fixed atmospheric correction for land (bright B8 areas). Slight errors in the tuning of these transitions can result in unnatural tonal steps in the transitions between these areas, particularly in very shallow areas. For the Landsat 8 image processing land areas appear as black from the sun glint correction, which doesn't separately mask out the land. The code for the Landsat 8 imagery is less developed than for the Sentinel 2 imagery. The depth contours are estimated using satellite derived bathymetry that is subject to errors caused by cloud artefacts, substrate darkness, water clarity, calibration issues and uncorrected tides. They were tuned in the clear waters of the Coral Sea. The depth contours in this dataset are RAW and contain many false positives due to clouds. They should not be used without additional dataset cleanup. Change log: As changes are made to the dataset, or additional image collections are added to the dataset then those changes will be recorded here. 1st Edition, 2024-03-18: Initial publication of the dataset, with CS_NESP-MaC-2-3_AIMS_Benth-reflect, CS_NESP-MaC-2-3_AIMS_Oceanic-veg and code for AU_NESP-MaC-3-17_AIMS_Reef-mapping and Default projects. Data Format: GeoTiff images with LZW compression. Most images do not have internal image pyramids to save on storage space. Data Location: This dataset is filed in the eAtlas enduring data repository at: data\custodian\2020-2029-AIMS\Wld-AIMS-Marine-sat-img
-
This layer shows a 500m resolution image of the world derived from the Blue Marble Next Generation April 2004 image (86400x43200 pixels). As the image was derived from MODIS satellite imagery during Autumn in the Northern Hemisphere the high latitude countries (Russia, Canada, etc) are covered in snow. The colour and tonal range of the original Blue Marble image was compressed and brightened to make the image suitable for use as a basemap. In addition to this noise filtering was applied to de-clutter the image somewhat to make it more suitable as a layer under hillshading, with the aim of the layer being to provide colour to the hillshading. The processing of the images was performed in Photoshop and the geo-referencing and final preparation was done using GDAL. This image is made available as a 357 MB JPEG compressed GeoTiff file as part of the Bright Earth basemap dataset.
-
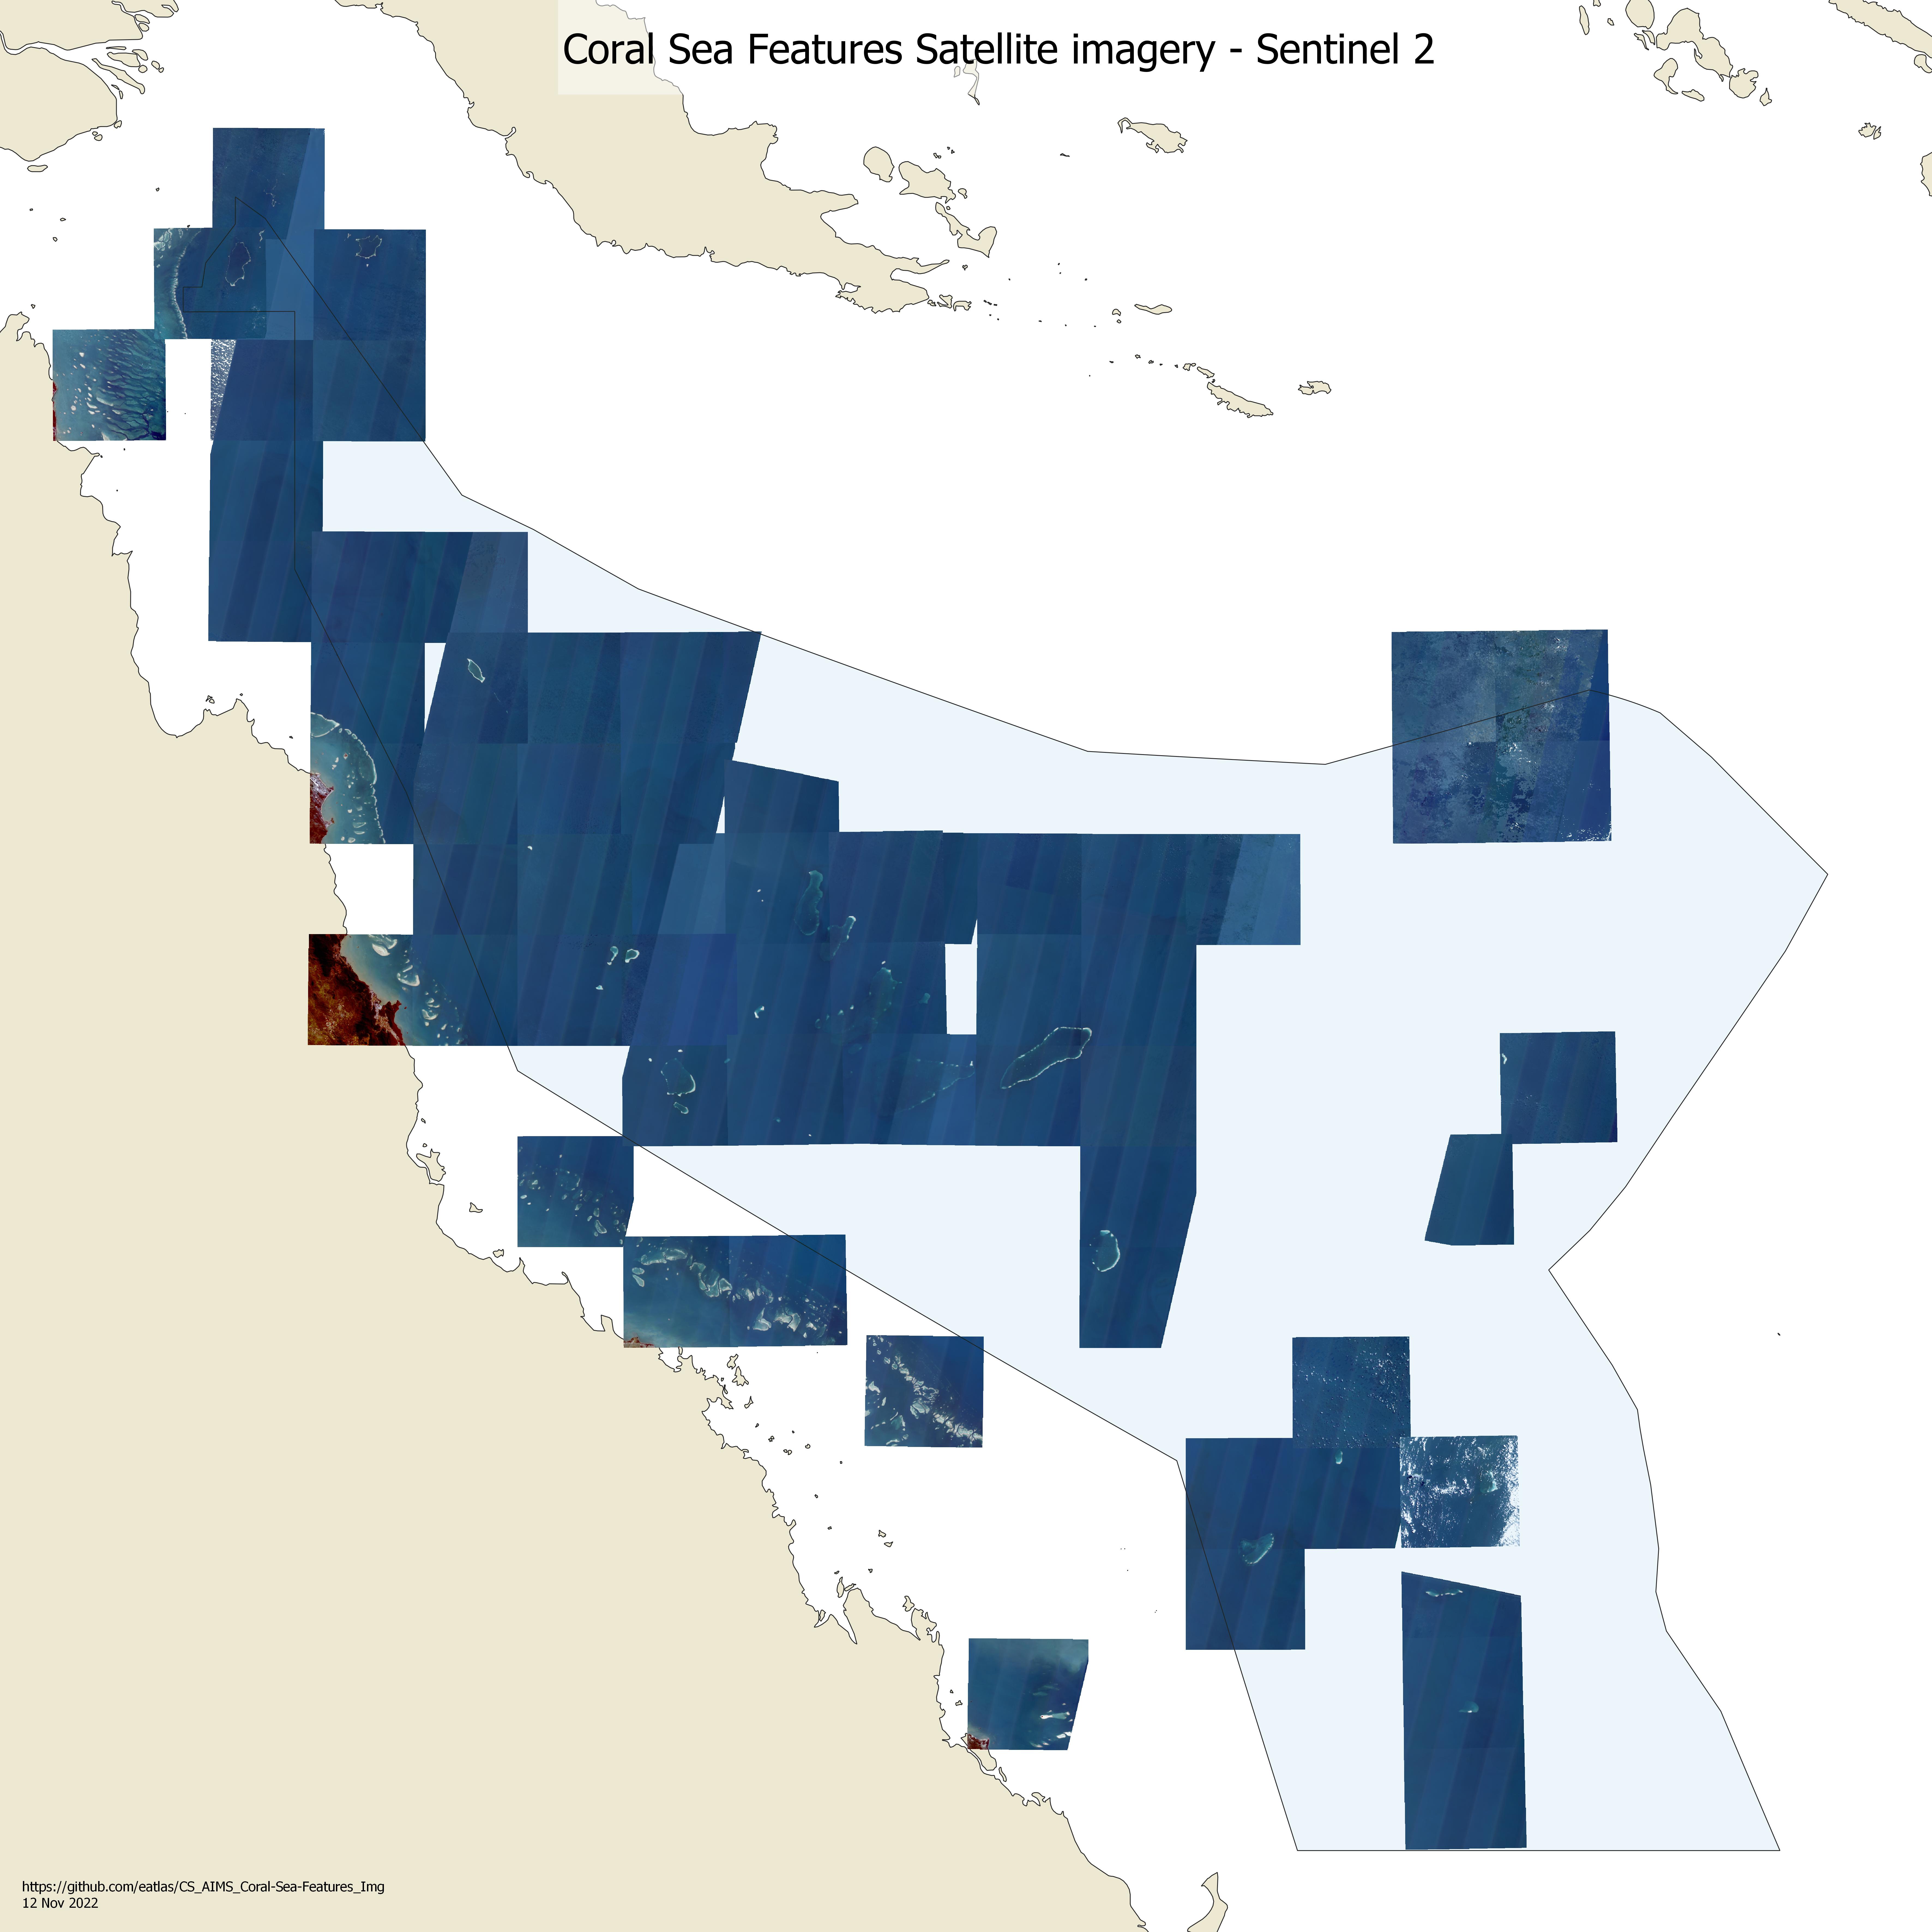
This dataset contains Sentinel 2 and Landsat 8 cloud free composite satellite images of the Coral Sea reef areas and some parts of the Great Barrier Reef. It also contains raw depth contours derived from the satellite imagery. This dataset was developed as the base information for mapping the boundaries of reefs and coral cays in the Coral Sea. It is likely that the satellite imagery is useful for numerous other applications. The full source code is available and can be used to apply these techniques to other locations. This dataset contains two sets of raw satellite derived bathymetry polygons for 5 m, 10 m and 20 m depths based on both the Landsat 8 and Sentinel 2 imagery. These are intended to be post-processed using clipping and manual clean up to provide an estimate of the top structure of reefs. This dataset also contains select scenes on the Great Barrier Reef and Shark bay in Western Australia that were used to calibrate the depth contours. Areas in the GBR were compared with the GA GBR30 2020 (Beaman, 2017) bathymetry dataset and the imagery in Shark bay was used to tune and verify the Satellite Derived Bathymetry algorithm in the handling of dark substrates such as by seagrass meadows. This dataset also contains a couple of small Sentinel 3 images that were used to check the presence of reefs in the Coral Sea outside the bounds of the Sentinel 2 and Landsat 8 imagery. The Sentinel 2 and Landsat 8 imagery was prepared using the Google Earth Engine, followed by post processing in Python and GDAL. The processing code is available on GitHub (https://github.com/eatlas/CS_AIMS_Coral-Sea-Features_Img). This collection contains composite imagery for Sentinel 2 tiles (59 in Coral Sea, 8 in GBR) and Landsat 8 tiles (12 in Coral Sea, 4 in GBR and 1 in WA). For each Sentinel tile there are 3 different colour and contrast enhancement styles intended to highlight different features. These include: - `TrueColour` - Bands: B2 (blue), B3 (green), B4 (red): True colour imagery. This is useful to identifying shallow features are and in mapping the vegetation on cays. - `DeepFalse` - Bands: B1 (ultraviolet), B2 (blue), B3 (green): False colour image that shows deep marine features to 50 - 60 m depth. This imagery exploits the clear waters of the Coral Sea to allow the ultraviolet band to provide a much deeper view of coral reefs than is typically achievable with true colour imagery. This imagery has a high level of contrast enhancement applied to the imagery and so it appears more noisy (in particular showing artefact from clouds) than the TrueColour styling. - `Shallow` - Bands: B5 (red edge), B8 (Near Infrared) , B11 (Short Wave infrared): This false colour imagery focuses on identifying very shallow and dry regions in the imagery. It exploits the property that the longer wavelength bands progressively penetrate the water less. B5 penetrates the water approximately 3 - 5 m, B8 approximately 0.5 m and B11 < 0.1 m. Features less than a couple of metres appear dark blue, dry areas are white. This imagery is intended to help identify coral cay boundaries. For Landsat 8 imagery only the `TrueColour` and `DeepFalse` stylings were rendered. All Sentinel 2 and Landsat 8 imagery has Satellite Derived Bathymetry (SDB) depth contours. - `Depth5m` - This corresponds to an estimate of the area above 5 m depth (Mean Sea Level). - `Depth10m` - This corresponds to an estimate of the area above 10 m depth (Mean Sea Level). - `Depth20m` - This corresponds to an estimate of the area above 20 m depth (Mean Sea Level). For most Sentinel and some Landsat tiles there are two versions of the DeepFalse imagery based on different collections (dates). The R1 imagery are composites made up from the best available imagery while the R2 imagery uses the next best set of imagery. This splitting of the imagery is to allow two composites to be created from the pool of available imagery. This allows any mapped features to be checked against two images. Typically the R2 imagery will have more artefacts from clouds. In one Sentinel 2 tile a third image was created to help with mapping the reef platform boundary. The satellite imagery was processed in tiles (approximately 100 x 100 km for Sentinel 2 and 200 x 200 km for Landsat 8) to keep each final image small enough to manage. These tiles were not merged into a single mosaic as it allowed better individual image contrast enhancement when mapping deep features. The dataset only covers the portion of the Coral Sea where there are shallow coral reefs and where their might have been potential new reef platforms indicated by existing bathymetry datasets and the AHO Marine Charts. The extent of the imagery was limited by those available through the Google Earth Engine. # Methods: The Sentinel 2 imagery was created using the Google Earth Engine. The core algorithm was: 1. For each Sentinel 2 tile, images from 2015 – 2021 were reviewed manually after first filtering to remove cloudy scenes. The allowable cloud cover was adjusted so that at least the 50 least cloud free images were reviewed. The typical cloud cover threshold was 1%. Where very few images were available the cloud cover filter threshold was raised to 100% and all images were reviewed. The Google Earth Engine image IDs of the best images were recorded, along with notes to help sort the images based on those with the clearest water, lowest waves, lowest cloud, and lowest sun glint. Images where there were no or few clouds over the known coral reefs were preferred. No consideration of tides was used in the image selection process. The collection of usable images were grouped into two sets that would be combined together into composite images. The best were added to the R1 composite, and the next best images into the R2 composite. Consideration was made as to whether each image would improve the resultant composite or make it worse. Adding clear images to the collection reduces the visual noise in the image allowing deeper features to be observed. Adding images with clouds introduces small artefacts to the images, which are magnified due to the high contrast stretching applied to the imagery. Where there were few images all available imagery was typically used. 2. Sunglint was removed from the imagery using estimates of the sunglint using two of the infrared bands (described in detail in the section on Sun glint removal and atmospheric correction). 3. A composite image was created from the best images by taking the statistical median of the stack of images selected in the previous stage, after masking out clouds and their shadows (described in detail later). 4. The brightness of the composite image was normalised so that all tiles would have a similar average brightness for deep water areas. This correction was applied to allow more consistent contrast enhancement. Note: this brightness adjustment was applied as a single offset across all pixels in the tile and so this does not correct for finer spatial brightness variations. 5. The contrast of the images was enhanced to create a series of products for different uses. The `TrueColour` colour image retained the full range of tones visible, so that bright sand cays still retain detail. The `DeepFalse` style was optimised to see features at depth and the `Shallow` style provides access to far red and infrared bands for assessing shallow features, such as cays and island. 6. The various contrast enhanced composite images were exported from Google Earth Engine and optimised using Python and GDAL. This optimisation added internal tiling and overviews to the imagery. The depth polygons from each tile were merged into shapefiles covering the whole for each depth. ## Cloud Masking Prior to combining the best images each image was processed to mask out clouds and their shadows. The cloud masking uses the COPERNICUS/S2_CLOUD_PROBABILITY dataset developed by SentinelHub (Google, n.d.; Zupanc, 2017). The mask includes the cloud areas, plus a mask to remove cloud shadows. The cloud shadows were estimated by projecting the cloud mask in the direction opposite the angle to the sun. The shadow distance was estimated in two parts. A low cloud mask was created based on the assumption that small clouds have a small shadow distance. These were detected using a 40% cloud probability threshold. These were projected over 400 m, followed by a 150 m buffer to expand the final mask. A high cloud mask was created to cover longer shadows created by taller, larger clouds. These clouds were detected based on an 80% cloud probability threshold, followed by an erosion and dilation of 300 m to remove small clouds. These were then projected over a 1.5 km distance followed by a 300 m buffer. The buffering was applied as the cloud masking would often miss significant portions of the edges of clouds and their shadows. The buffering allowed a higher percentage of the cloud to be excluded, whilst retaining as much of the original imagery as possible. The parameters for the cloud masking (probability threshold, projection distance and buffer radius) were determined through trial and error on a small number of scenes. The algorithm used is significantly better than the default Sentinel 2 cloud masking and slightly better than the COPERNICUS/S2_CLOUD_PROBABILITY cloud mask because it masks out shadows, however there is potentially significant improvements that could be made to the method in the future. Erosion, dilation and buffer operations were performed at a lower image resolution than the native satellite image resolution to improve the computational speed. The resolution of these operations were adjusted so that they were performed with approximately a 4 pixel resolution during these operations. This made the cloud mask significantly more spatially coarse than the 10 m Sentinel imagery. This resolution was chosen as a trade-off between the coarseness of the mask verse the processing time for these operations. With 4-pixel filter resolutions these operations were still using over 90% of the total processing resulting in each image taking approximately 10 min to compute on the Google Earth Engine. One problem with the cloud masking was that very bright sand cays were persistently interpreted as clouds resulting in transparent holes in the final composite images. To counter this the cloud masked composite was overlaid on a composite made with no cloud masking. This would infill the holes created by false positive masking. Since the imagery was selected to have minimal clouds over reef and cay areas the under lay introduced little or no clouds into the final composites. ## Sun glint removal and atmospheric correction. Sun glint was removed from the images using the infrared B8 band to estimate the reflection off the water from the sun glint. B8 penetrates water less than 0.5 m and so in water areas it only detects reflections off the surface of the water. The sun glint detected by B8 correlates very highly with the sun glint experienced by the ultra violet and visible channels (B1, B2, B3 and B4) and so the sun glint in these channels can be removed by subtracting B8 from these channels. This simple sun glint correction fails in very shallow and land areas. On land areas B8 is very bright and thus subtracting it from the other channels results in black land. In shallow areas (< 0.5 m) the B8 channel detects the substrate, resulting in too much sun glint correction. To resolve these issues the sun glint correction was adjusted by transitioning to B11 for very shallow areas. B11 penetrates the water much less than B8. We don't use B11 everywhere because it is half the resolution of B8. Land areas need their tonal levels to be adjusted to match the water areas after sun glint correction. Ideally this would be achieved using an atmospheric correction that compensates for the contrast loss due to haze in the atmosphere. Complex models for atmospheric correction involve considering the elevation of the surface (higher areas have less atmosphere to pass through) and the weather conditions. Since this dataset is focused on coral reef areas, elevation compensation is unnecessary due to the very low and flat land features being imaged. Additionally the focus of the dataset it on marine features and so only a basic atmospheric correction is needed. Land areas (as determined by very bright B8 areas) were assigned a fixed smaller correction factor to approximate atmospheric correction. This fixed atmospheric correction was determined iteratively so that land areas matched the tonal value of shallow and water areas. ## Depth contours The depth contours in this dataset were derived from the composite imagery. Satellite Derive Bathymetry (SDB) requires reference bathymetry to tune transformation from brightness in the imagery to its associated depth. No high resolution shallow bathymetry was available in the Coral Sea and so the SDB algorithms were calibrated against reefs in the outer Great Barrier Reef where reference bathymetry, GA GBR30 2020 (Beaman, 2017) was available. In this dataset we focused on generating specific depth contours rather than a fully linear bathymetry dataset. The 5 m and 10 m depth contours were estimated using the following algorithm: (ln(Green)/ln(Blue-BlackLevel))*UnitScalar-UnitOffset, where Green corresponds to the green channel (B3) and Blue corresponds to the blue channel (B2). The BlackLevel adjusts the relative contrast and colour balance between the blue and green channel and was tuned to provide the best compensation for dark substrates such as seagrass at 8 - 10 m. This tuning was performed using the imagery from Shark Bay, as this region has shallow clear waters with a mix of sand and seagrass. The UnitScalar and UnitOffset values transform the log ratio into units of metres. These were tuned by starting with a rough estimate then successively tuning the values so that the 5 m and 10 m contours would best match the GBR30 dataset on the Great Barrier Reef, and the results obtained with Landsat 8 and Sentinel 2 would align in the Coral Sea. To further calibrate and validate these contours they were compared to the deepest features visible in the red (B4) and far red (B5) channels of Sentinel 2. These channels are limited in their depth penetration, ~5 m for B5 and ~6-8 m for B4. This depth limit is due to the absorption of light in the red and far red part of the spectrum and thus they represent an excellent independent reference depth. The SDB algorithm performs poorly for depths below 12-15 m and so could not be used for creating the 20 m depth contour product. Instead the 20 m contour was generated by applying a brightness threshold to the green channel (B3). The threshold was calibrated against multiple Sentinel 2 scenes on the GBR and the GBR30 dataset. This technique relies on the fact that the green only penetrates to a depth of 28 - 30 m in clear water and so features deeper than this are guaranteed to not create false positives. At depths close to the limit (such as 20 m) the contrast is reduced leading to less susceptibility to variations in substrate brightness. See change log 2023-02-06. Spatial filtering was applied to reduce the noise in all depth contours products. This means that many of the small reef features (< ~50 m) are not represented in the contours. The resulting contours were: -5 m MSL +- 1.5 m, -10 m +- 2 m MSL and -20 m MSL +- 6 m. Additional details about the depth calibration can be found in the Google Earth Engine source code on GitHub. # Format: - Sentinel 2 - GeoTiff - LZW compressed, 8 bit channels, 0 as NoData, Imagery as values 1 - 255. Internal tiling and overviews. Average size: 11500 x 11500 pixels and 300 MB per image. - Landsat 8 - GeoTiff - LZW compressed, 8 bit channels, 0 as NoData, Imagery as values 1 - 255. Internal tiling and overviews. Average size: 7750 x 7780 pixels and 35 - 60 MB per image. - Raw 5 m, 10 m, 20 m Depth Contour polygons - Shapefiles - Coral Sea 94 MB, GBR 60 MB - Preview imagery - JPEG - 50% resolution versions of the Sentinel 2 and Landsat 8 images (1 - 5 MB each) ## Filename conventions The images in this dataset are all named using a naming convention. An example file name is `CS_AIMS_Coral-Sea-Features_Imagery_S2_R1_DeepFalse_54LZP.tif`. The name is made up from: - Dataset name (`CS_AIMS_Coral-Sea-Features_Imagery`). This is the imagery used in the digitisation of the `CS_AIMS_Coral-Sea-Features` dataset. - Satellite source: `L8` for Landsat 8 or `S2` for Sentinel 2. - Best imagery (`R1`) or second reference imagery (`R2`), `R3` for third reference image, - Colour and contrast enhancement applied (`DeepFalse`, `TrueColour`,`Shallow`,`Depth5m`,`Depth10m`,`Depth20m`), - Image tile (example: Sentinel 2 `54LZP`, Landsat 8 `091086`) # Limitations: In some scenes (56KQB and 56KPC) very few Sentinel 2 images were available leading to poor image composites. In these cases Landsat 8 images were developed and used for reef boundary mapping. Due to the high contrast enhancement applied in the `DeepFalse` composites masked out clouds create significant visual artefacts that need to be considered when mapping from this imagery. Additionally slight differences in the sensitivity and angle of the Sentinel 2 MSI imager sensors results in uncorrected diagonal tonal bands in the imagery. The `Slope` composites show the cloud masks a rings in the images, and care needs to be made not to interpret these as reef features. Only simple atmospheric correction was applied to land areas and as a result the imagery only approximates the bottom of atmosphere reflectance. For the sentinel 2 imagery the sun glint correction algorithm transitions between different correction levels from deep water (B8) to shallow water (B11) and a fixed atmospheric correction for land (bright B8 areas). Slight errors in the tuning of these transitions can result in unnatural tonal steps in the transitions between these areas. For the Landsat 8 image the sun glint correction did not consider land areas and so these appear as black in the imagery. The depth contours are estimated using satellite derived bathymetry that is subject to errors caused by cloud artefacts, substrate darkness, calibration issues and uncorrected tides. The depth contours in this dataset are RAW and contain many false positives due to clouds. They should not be used without additional dataset cleanup. The intention is that areas outside the reef boundaries should be clipped (to remove cloud artefacts) and where a reef is disrupted by clouds, such as Kenn Reef in the Sentinel 2 imagery, then the Landsat 8 depth contours can be used instead. The raw depth contours were generated in both the GBR and Coral Sea region, however depth contours in the GBR are only valid in areas where the water clarity is high. The depth contours of all inshore areas will be WRONG due to lower water clarity. The depth contours products should NOT be used for navigation. The algorithm smooths out small features to lower noise in the contours, resulting in small reefs (< 50 m) being removed. As a result there will be many shipping hazards not detected in these contours. Additionally the depth contours are affected by substrate reflectivity and so darker substrates need to be shallower to be included in the contour. The depth contour products are very slow to render as the entire regions (GBR and Coral Sea) are represented as a single multi-polygon. Speed issues could be resolved by subsequent post processing of the dataset split it into multiple polygons. # Change log 2022-11-12 Depth contour products for 5 m, 10 m and 20 m, were refined and better calibrated. Imagery and depth contours from the GBR used for the depth calibration were added to the dataset, along with the imagery for Shark Bay. These were added for completeness. 2023-02-06 Comparison between the 20 m contour and the GBR bathymetry 30 m 2020 dataset on North and South Flinders island show that the contour corresponds to deeper waters over clear sandy areas and shallower over reef substrate. These are due to differences in the reflectivity of the substrate. In sandy areas on North and South Flinders reefs the contour closely matches 23 m depth whilst over reef substrate the contour corresponds to 17 m depth contour. On Saumarez Reefs the sandy areas match 23 m depth, whilst reef substrate corresponds to 14 m depth. # References: Beaman, R.J. 2017. High-resolution depth model for the Great Barrier Reef - 30 m. Geoscience Australia, Canberra. http://dx.doi.org/10.4225/25/5a207b36022d2 Google (n.d.) Sentinel-2: Cloud Probability. Earth Engine Data Catalog. Accessed 10 April 2021 from https://developers.google.com/earth-engine/datasets/catalog/COPERNICUS_S2_CLOUD_PROBABILITY Zupanc, A., (2017) Improving Cloud Detection with Machine Learning. Medium. Accessed 10 April 2021 from https://medium.com/sentinel-hub/improving-cloud-detection-with-machine-learning-c09dc5d7cf13 International Hydrographic Organization, Intergovernmental Oceanographic Commission, The IHO-IOC GEBCO Cook Book, IHO Publication B-11, Monaco, Oct. 2019, 493pp - IOC Manuals and Guides 63, France, Oct. 2019, 493pp # Data Location: This dataset is filed in the eAtlas enduring data repository at: data\custodian\2020-2029-AIMS\CS_AIMS_Coral-Sea-Features_Img The source code is available on [GitHub](https://github.com/eatlas/CS_AIMS_Coral-Sea-Features_Imagery).
-
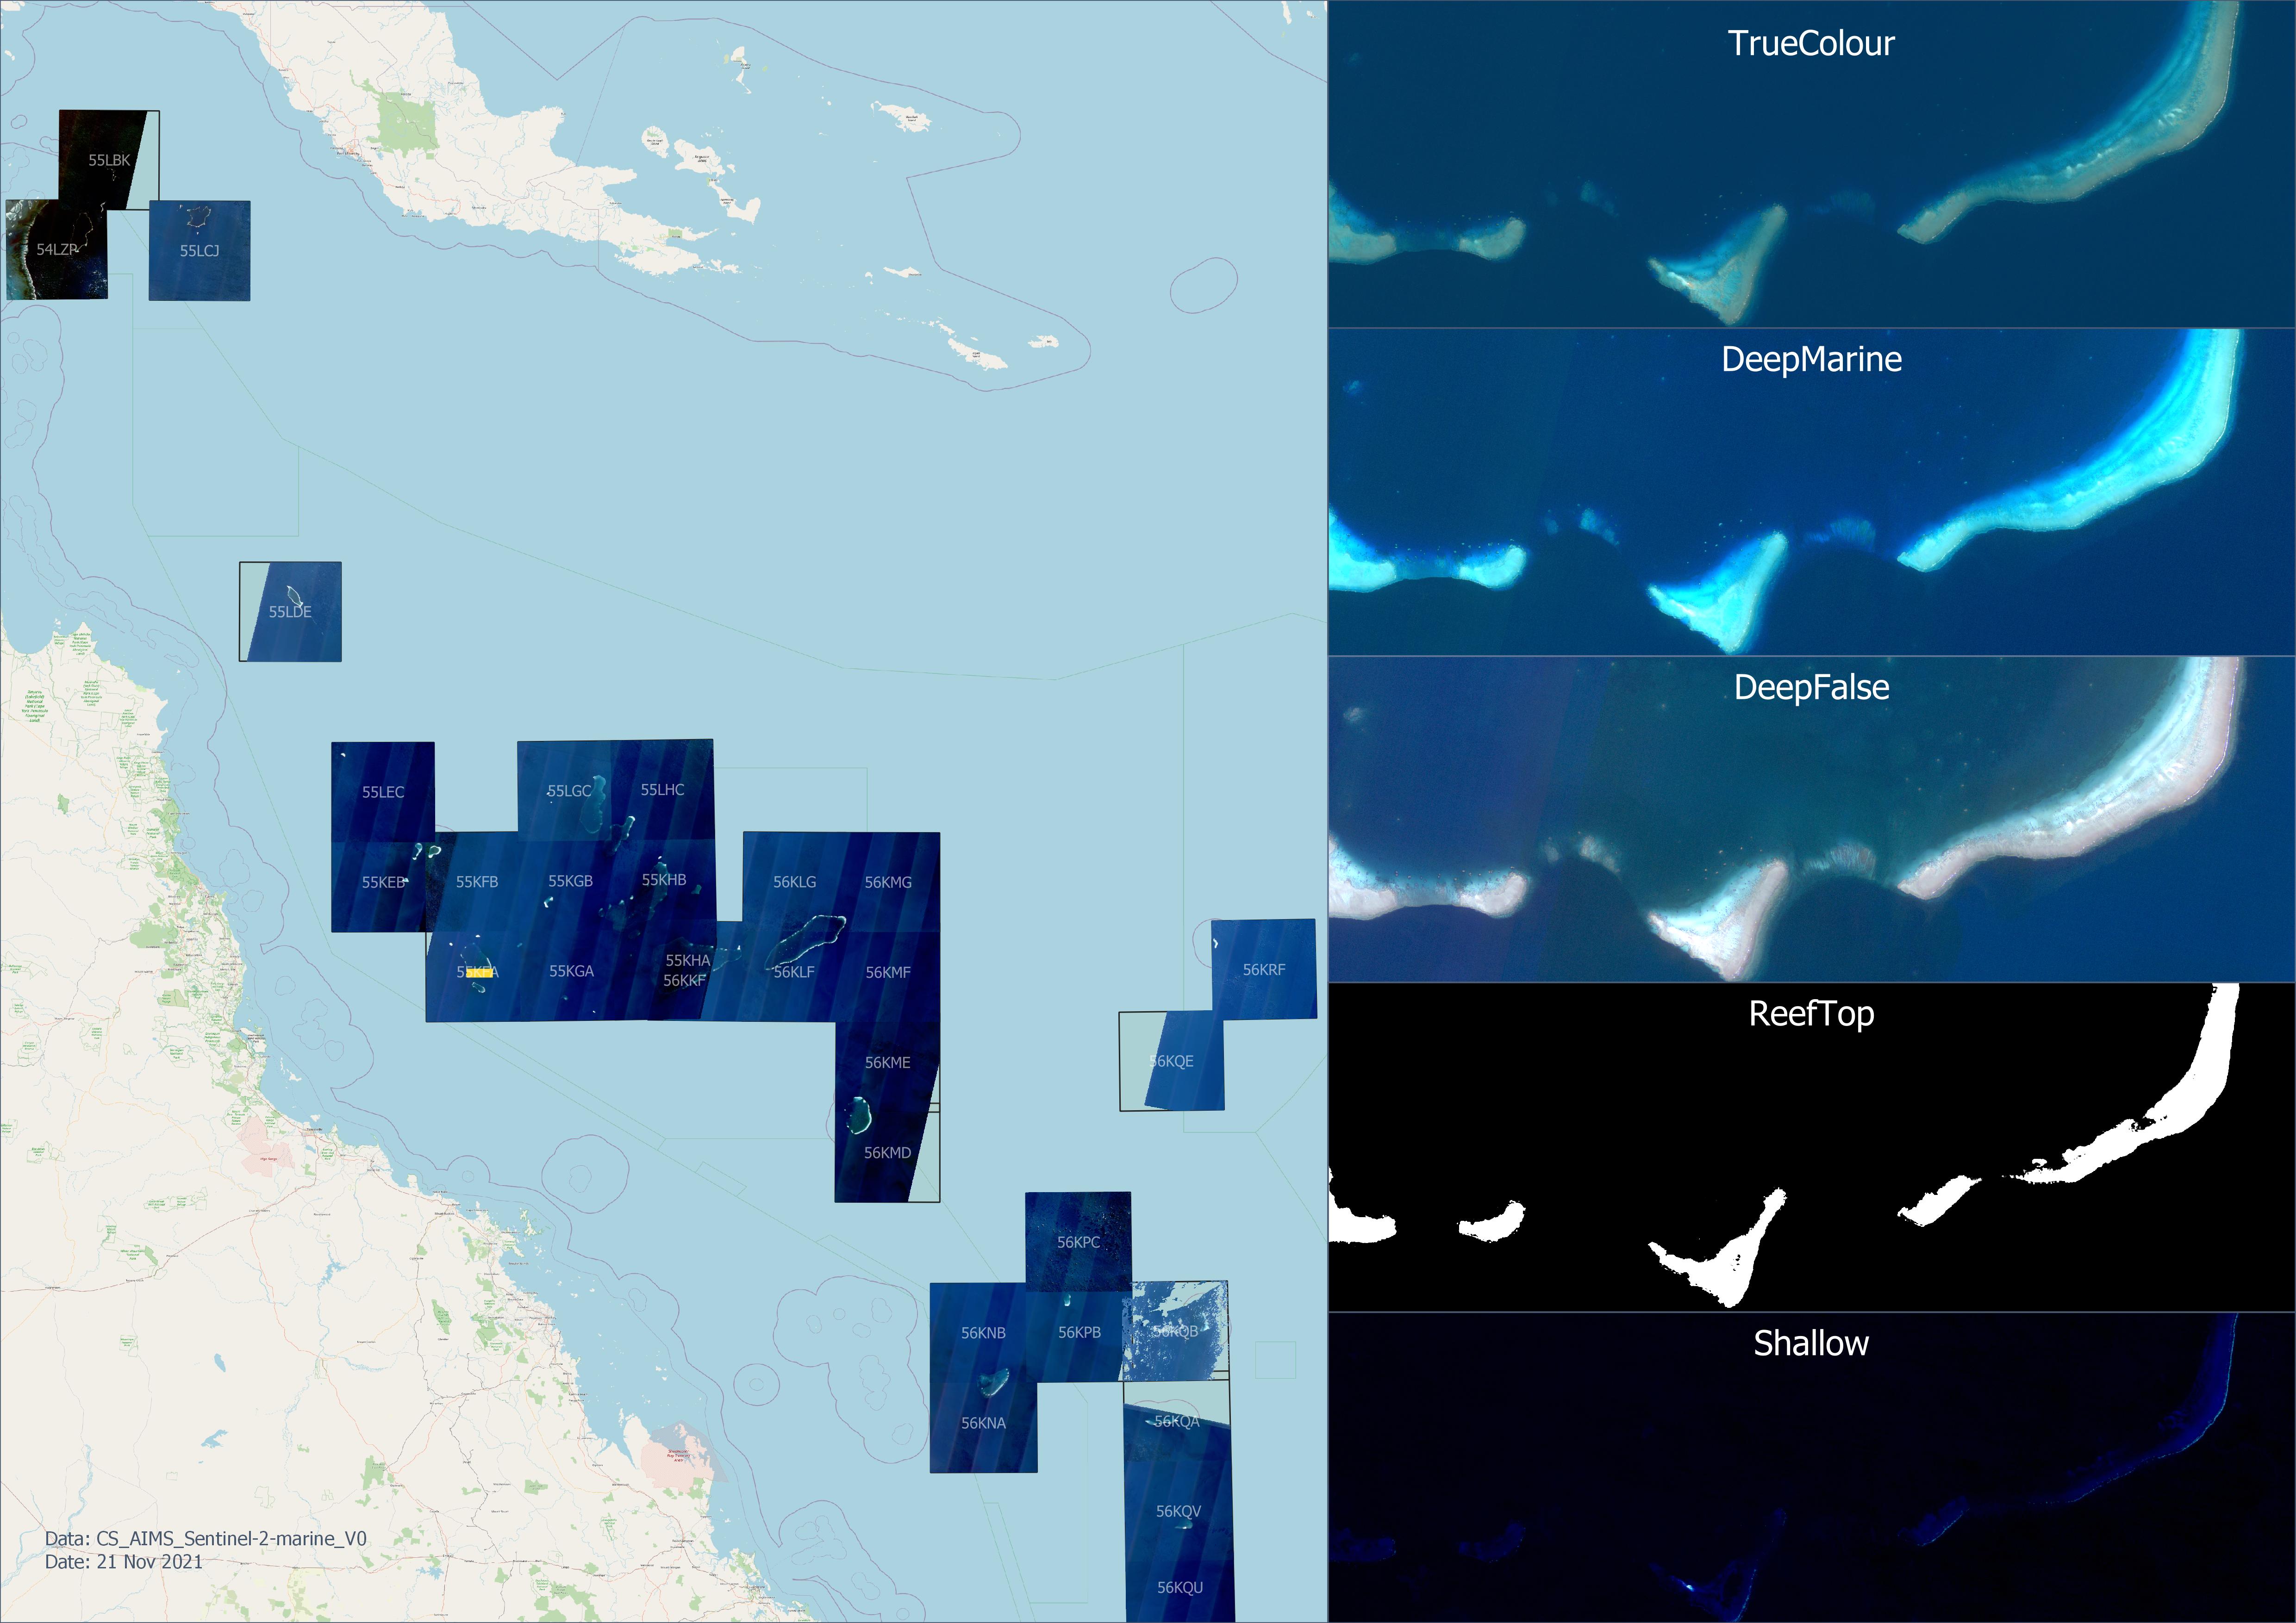
This dataset contains composite satellite images for the Coral Sea region based on 10 m resolution Sentinel 2 imagery from 2015 – 2021. This image collection is intended to allow mapping of the reef and island features of the Coral Sea. This is a draft version of the dataset prepared from approximately 60% of the available Sentinel 2 image. An improved version of this dataset was released https://doi.org/10.26274/NH77-ZW79. This collection contains composite imagery for 31 Sentinel 2 tiles in the Coral Sea. For each tile there are 5 different colour and contrast enhancement styles intended to highlight different features. These include: - `DeepFalse` - Bands: B1 (ultraviolet), B2 (blue), B3 (green): False colour image that shows deep marine features to 50 - 60 m depth. This imagery exploits the clear waters of the Coral Sea to allow the ultraviolet band to provide a much deeper view of coral reefs than is typically achievable with true colour imagery. This technique doesn't work where the water is not as clear as the ultraviolet get scattered easily. - `DeepMarine` - Bands: B2 (blue), B3 (green), B4 (red): This is a contrast enhanced version of the true colour imagery, focusing on being able to better see the deeper features. Shallow features are over exposed due to the increased contrast. - `ReefTop` - Bands: B3 (red): This imagery is contrast enhanced to create an mask (black and white) of reef tops, delineating areas that are shallower or deeper than approximately 4 - 5 m. This mask is intended to assist in the creating of a GIS layer equivalent to the 'GBR Dry Reefs' dataset. The depth mapping exploits the limited water penetration of the red channel. In clear water the red channel can only see features to approximately 6 m regardless of the substrate type. - `Shallow` - Bands: B5 (red edge), B8 (Near Infrared) , B11 (Short Wave infrared): This false colour imagery focuses on identifying very shallow and dry regions in the imagery. It exploits the property that the longer wavelength bands progressively penetrate the water less. B5 penetrates the water approximately 3 - 5 m, B8 approximately 0.5 m and B11 < 0.1 m. Feature less than a couple of metres appear dark blue, dry areas are white. - `TrueColour` - Bands: B2 (blue), B3 (green), B4 (red): True colour imagery. This is useful to interpreting what shallow features are and in mapping the vegetation on cays and identifying beach rock. For most Sentinel tiles there are two versions of the DeepFalse and DeepMarine imagery based on different collections (dates). The R1 imagery are composites made up from the best available imagery while the R2 imagery uses the next best set of imagery. This splitting of the imagery is to allow two composites to be created from the pool of available imagery so that mapped features could be checked against two images. Typically the R2 imagery will have more artefacts from clouds. The satellite imagery was processed in tiles (approximately 100 x 100 km) to keep each final image small enough to manage. The dataset only covers the portion of the Coral Sea where there are shallow coral reefs. # Methods: The satellite image composites were created by combining multiple Sentinel 2 images using the Google Earth Engine. The core algorithm was: 1. For each Sentinel 2 tile, the set of Sentinel images from 2015 – 2021 were reviewed manually. In some tiles the cloud cover threshold was raised to gather more images, particularly if there were less than 20 images available. The Google Earth Engine image IDs of the best images were recorded. These were the images with the clearest water, lowest waves, lowest cloud, and lowest sun glint. 2. A composite image was created from the best images by taking the statistical median of the stack of images selected in the previous stage, after masking out clouds and their shadows (described in detail later). 3. The contrast of the images was enhanced to create a series of products for different uses. The true colour image retained the full range of tones visible, so that bright sand cays still retained some detail. The marine enhanced version stretched the blue, green and red channels so that they focused on the deeper, darker marine features. This stretching was done to ensure that when converted to 8-bit colour imagery that all the dark detail in the deeper areas were visible. This contrast enhancement resulted in bright areas of the imagery clipping, leading to loss of detail in shallow reef areas and colours of land areas looking off. A reef top estimate was produced from the red channel (B4) where the contrast was stretched so that the imagery contains almost a binary mask. The threshold was chosen to approximate the 5 m depth contour for the clear waters of the Coral Sea. Lastly a false colour image was produced to allow mapping of shallow water features such as cays and islands. This image was produced from B5 (far red), B8 (nir), B11 (nir), where blue represents depths from approximately 0.5 – 5 m, green areas with 0 – 0.5 m depth, and brown and white corresponding to dry land. 4. The various contrast enhanced composite images were exported from Google Earth Engine (default of 32 bit GeoTiff) and reprocessed to smaller LZW compresed 8 bit GeoTiff images GDAL. ## Cloud Masking Prior to combining the best images each image was processed to mask out clouds and their shadows. The cloud masking uses the COPERNICUS/S2_CLOUD_PROBABILITY dataset developed by SentinelHub (Google, n.d.; Zupanc, 2017). The mask includes the cloud areas, plus a mask to remove cloud shadows. The cloud shadows were estimated by projecting the cloud mask in the direction opposite the angle to the sun. The shadow distance was estimated in two parts. A low cloud mask was created based on the assumption that small clouds have a small shadow distance. These were detected using a 40% cloud probability threshold. These were projected over 400 m, followed by a 150 m buffer to expand the final mask. A high cloud mask was created to cover longer shadows created by taller, larger clouds. These clouds were detected based on an 80% cloud probability threshold, followed by an erosion and dilation of 300 m to remove small clouds. These were then projected over a 1.5 km distance followed by a 300 m buffer. The parameters for the cloud masking (probability threshold, projection distance and buffer radius) were determined through trial and error on a small number of scenes. As such there are probably significant potential improvements that could be made to this algorithm. Erosion, dilation and buffer operations were performed at a lower image resolution than the native satellite image resolution to improve the computational speed. The resolution of these operations were adjusted so that they were performed with approximately a 4 pixel resolution during these operations. This made the cloud mask significantly more spatially coarse than the 10 m Sentinel imagery. This resolution was chosen as a trade-off between the coarseness of the mask verse the processing time for these operations. With 4-pixel filter resolutions these operations were still using over 90% of the total processing resulting in each image taking approximately 10 min to compute on the Google Earth Engine. ## Sun glint removal and atmospheric correction. Sun glint was removed from the images using the infrared B8 band to estimate the reflection off the water from the sun glint. B8 penetrates water less than 0.5 m and so in water areas it only detects reflections off the surface of the water. The sun glint detected by B8 correlates very highly with the sun glint experienced by the ultra violet and visible channels (B1, B2, B3 and B4) and so the sun glint in these channels can be removed by subtracting B8 from these channels. This simple sun glint correction fails in very shallow and land areas. On land areas B8 is very bright and thus subtracting it from the other channels results in black land. In shallow areas (< 0.5 m) the B8 channel detects the substrate, resulting in too much sun glint correction. To resolve these issues the sun glint correction was adjusted by transitioning to B11 for shallow areas as it penetrates the water even less than B8. We don't use B11 everywhere because it is half the resolution of B8. Land areas need their tonal levels to be adjusted to match the water areas after sun glint correction. Ideally this would be achieved using an atmospheric correction that compensates for the contrast loss due to haze in the atmosphere. Complex models for atmospheric correction involve considering the elevation of the surface (higher areas have less atmosphere to pass through) and the weather conditions. Since this dataset is focused on coral reef areas, elevation compensation is unnecessary due to the very low and flat land features being imaged. Additionally the focus of the dataset it on marine features and so only a basic atmospheric correction is needed. Land areas (as determined by very bright B8 areas) where assigned a fixed smaller correction factor to approximate atmospheric correction. This fixed atmospheric correction was determined iteratively so that land areas matched the tonal value of shallow and water areas. ## Image selection Available Sentinel 2 images with a cloud cover of less than 0.5% were manually reviewed using an Google Earth Engine App [01-select-sentinel2-images.js](https://github.com/eatlas/CS_AIMS_Sentinel-2-marine_V0/blob/main/src/02-gee-scripts/01-select-sentinel2-images.js). Where there were few images available (less than 30 images) the cloud cover threshold was raised to increase the set of images that were raised. Images were excluded from the composites primarily due to two main factors: sun glint and fine scattered clouds. The images were excluded if there was any significant uncorrected sun glint in the image, i.e. the brightness of the sun glint exceeded the sun glint correction. Fine scattered clouds over reef areas were also a strong factor in down grading the quality rating of the image. As each satellite images were reviewed they were characterised into four classes: - `Excellent` – Almost perfectly cloud free. - `Good` – Large sections of the imagery are cloud free, particularly areas of reefs, and there is no remaining sun glint. Clouds in the image are low and not very small. - `OK` – Moderate areas of the image are cloud free (>30 %), particularly where there are reefs. No remaining sun glint (after correction). - `Maybe` – Some useful areas of imagery are visible and with enough images the clouds in the image might be able to be removed. Images that have lots of very small clouds are still generally excluded. No significant sun glint (<5%) after correction in the image. The images were then grouped to create two reference composite images. The first reference composite image (`R1`) was based on the best set of images available (typically the `Excellent`, `Good` and sometimes `OK` images) and the second reference image (`R2`) made up of the remaining images (typically from the `OK` and `Maybe` category). If there were enough `Excellent`, `Good` or `OK` images then the `Maybe` category images were unused. The categories and the final images used to create each of the composite images is recorded in the Google Earth Engine script [03-create-composite-Coral-Sea.js](https://github.com/eatlas/CS_AIMS_Sentinel-2-marine_V0/blob/main/src/02-gee-scripts/03-create-composite-Coral-Sea.js). To speed up the implementation speed of this draft version of the datasets only approximately 50 – 70 % of the available imagery was reviewed, typically stopping once 30 – 40 images were reviewed, or sufficient good images were collected to create reasonable composite images. Since the images were reviewed from oldest to newest imagery this resulted in a bias towards the composite images containing older imagery. Where a tile scene was split over two satellite passes more images were previewed and collated to ensure that there were enough images in both the left and right sections of the image tile. A minimum of 4 images were combined for OK and Good classification and typically 6 – 8 used for images of the Maybe category. # Format: GeoTiff - LZW compressed, 8 bit channels, 0 as NoData, Imagery as values 1 - 255. Internal tiling and overviews. Average size: 11500 x 11500 pixels and 300 MB per image. The images in this dataset are all named using a naming convention. An example file name is `CS_AIMS_Sentinel2-marine_V0_R1_DeepFalse_54LZP_201808-202106-n3.tif`. The name is made up from: - Dataset name (`CS_AIMS_Sentinel2-marine`) - A dataset version number (`V0`), - Best imagery (`R1`) or second reference imagery (`R2`), - Colour and contrast enhancement applied (`DeepFalse`, `DeepMarine`, `ReefTop`, `Shallow`, `TrueColour`), - Sentinel 2 tile (example: `54LZP`), - Start and end year and month of the dates of the images in the image composite (example: `201808-202106`) - Number of images that were combined to make the image (example: `n3`) # Limitations: To save development time only 50 - 70 % of all the Sentinel 2 imagery was reviewed to create the final imagery in this version of this dataset. Heavy contrast enhancements applied to the `DeepMarine` and `DeepFalse` composites result in some scenes being darker than ideal. The thresholds used in the contrast enhancement are fixed and very sensitive to very small variations in uncorrected brightness in each scene. The `DeepFalse` scenes near PNG (55LBK, 54LZP, 55LCJ) are too dark due to a decrease in the water clarity. Ideally the contrast thresholds should to be adjusted to make these images more usable. In some scenes (56KQB and 56KPC) very few Sentinel 2 images were available leading to poor image composites. Due to the high contrast enhancement applied in the `DeepFalse` and `DeepMarine` composites and the relatively few images used to create these composites, masked out clouds create significant visual artefacts that need to be considered when mapping from this imagery. Additionally slight differences in the sensitivity and angle of the Sentinel 2 MSI imager sensors results in uncorrected diagonal tonal bands in the imagery. Only simple atmospheric correction was applied to land areas. The sun glint correction algorithm transitions between different correction levels from deep water (B8) to shallow water (B11) and a fixed atmospheric correction for land (bright B8 areas). Slight errors in the tuning of these transitions can result in unnatural tonal steps in the transitions between these areas. # References: Google (n.d.) Sentinel-2: Cloud Probability. Earth Engine Data Catalog. Accessed 10 April 2021 from https://developers.google.com/earth-engine/datasets/catalog/COPERNICUS_S2_CLOUD_PROBABILITY Zupanc, A., (2017) Improving Cloud Detection with Machine Learning. Medium. Accessed 10 April 2021 from https://medium.com/sentinel-hub/improving-cloud-detection-with-machine-learning-c09dc5d7cf13 # Data Location: This dataset is filed in the eAtlas enduring data repository at: data\Other\CS_AIMS_Sentinel-2-marine_V0 The source code is available on [GitHub](https://github.com/eatlas/CS_AIMS_Sentinel-2-marine_V0).
-
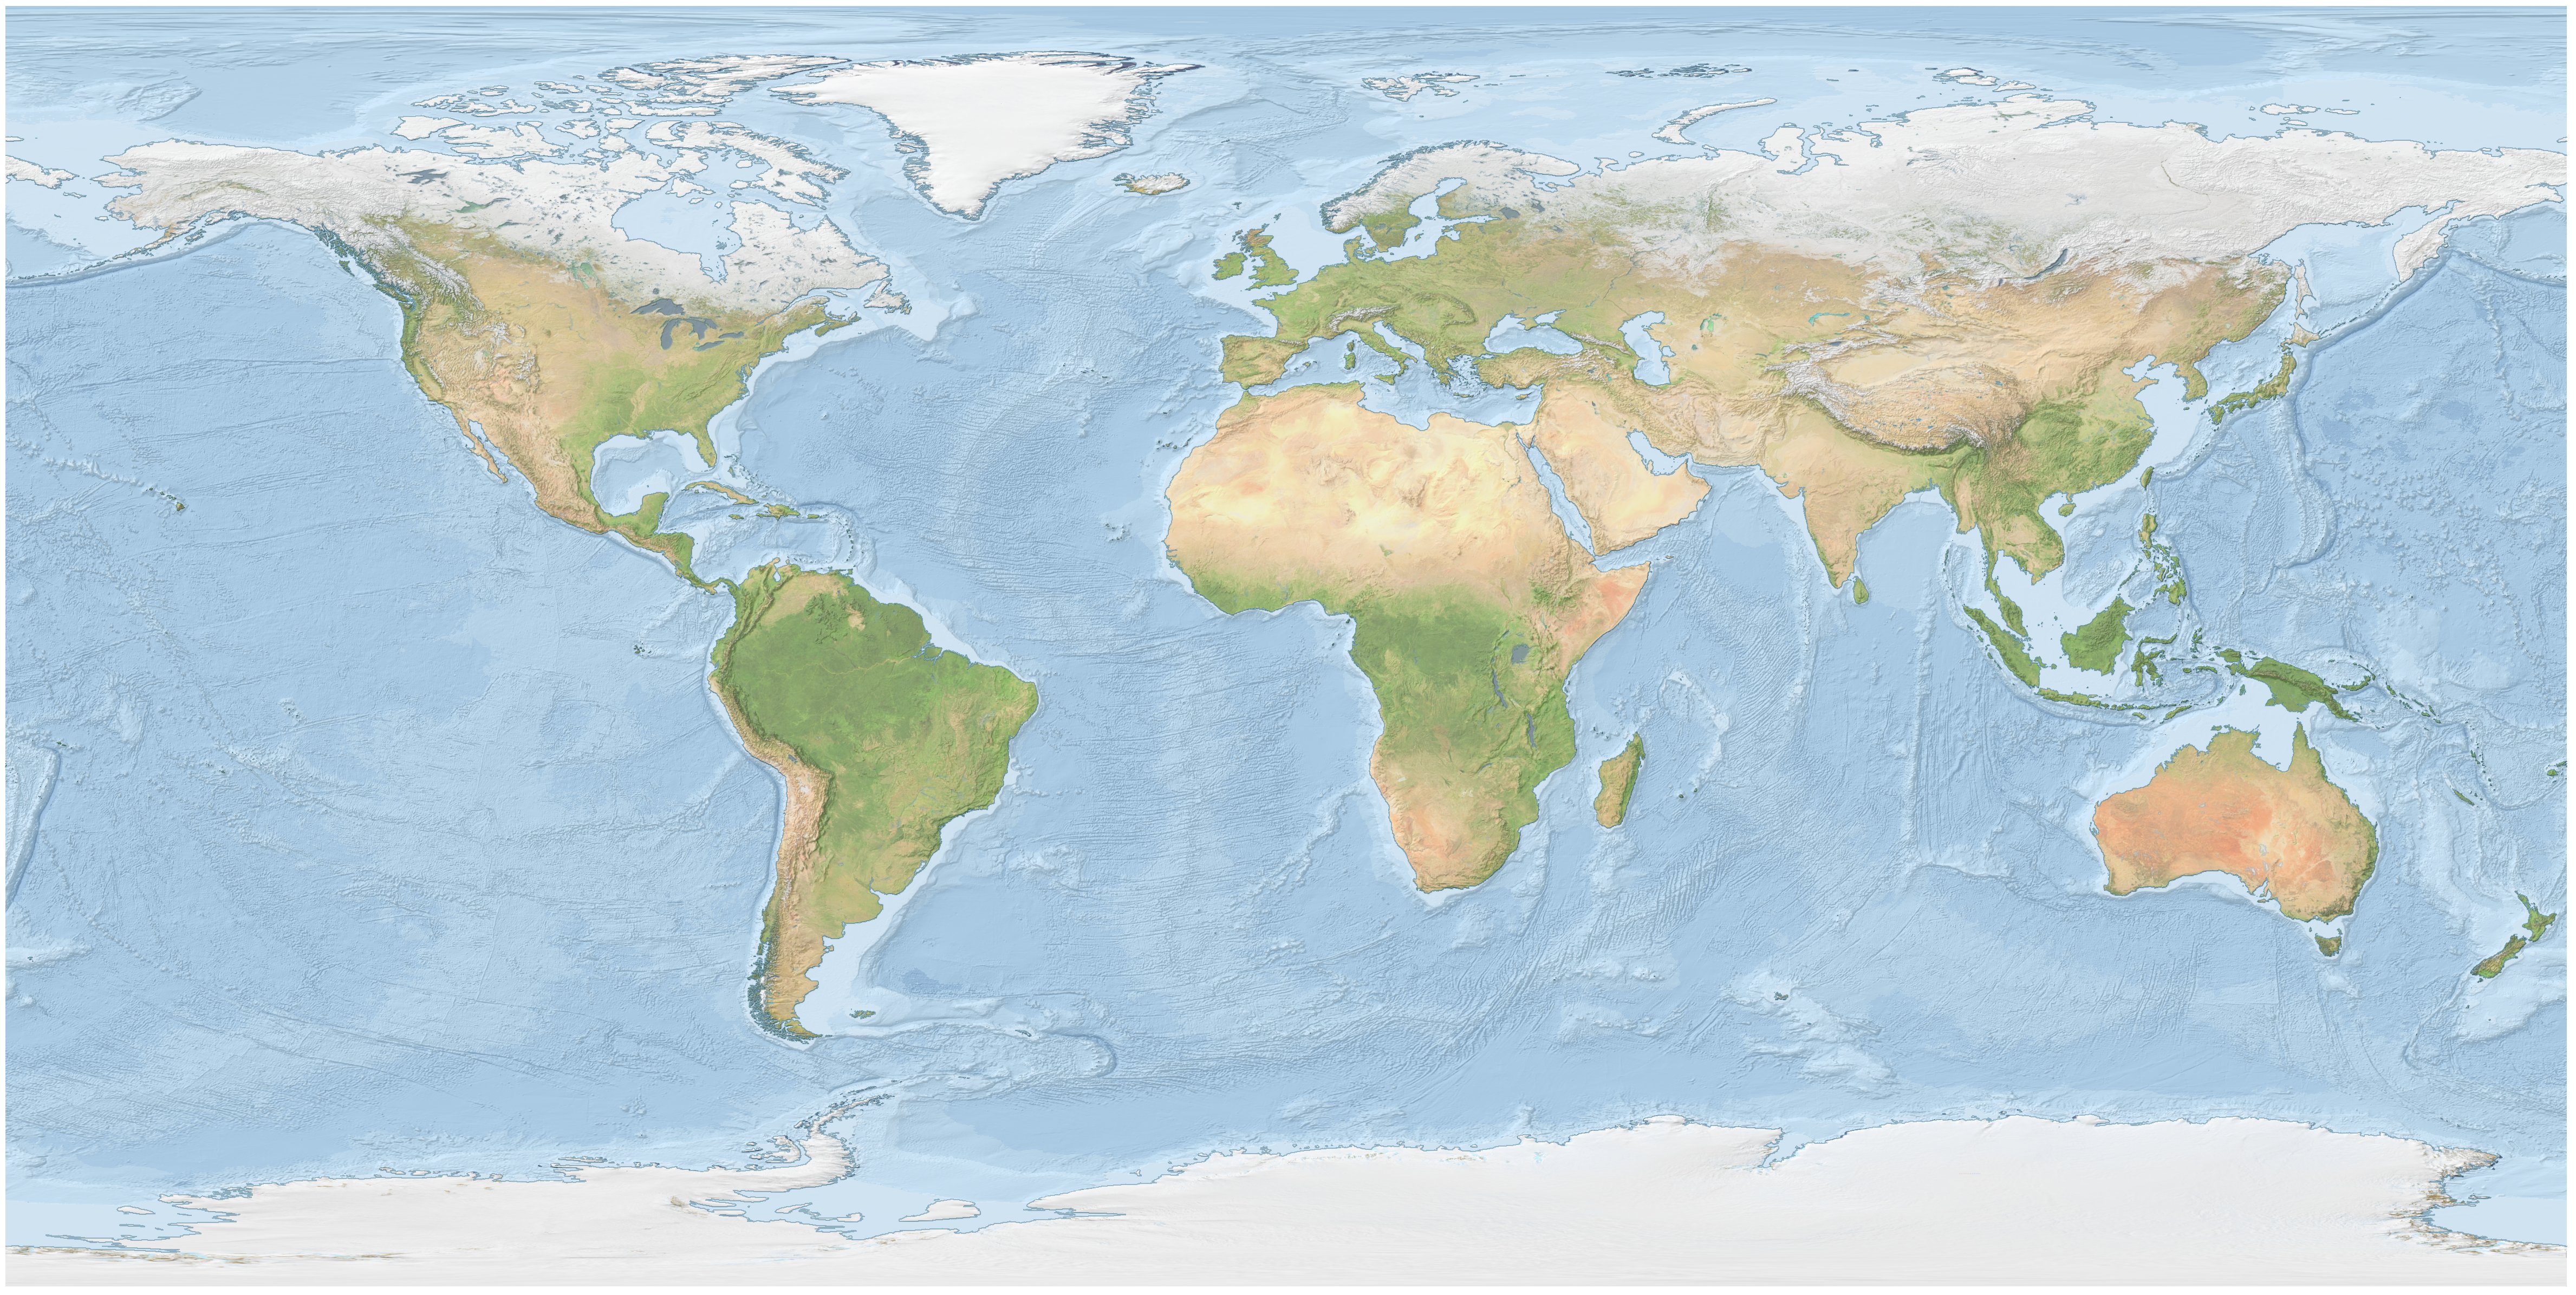
The Bright Earth eAtlas Basemap dataset collection is a satellite-derived global map of the world at a 1:1M scale for most of the world and 1:200k scale for Australia. This map was inspired by Natural Earth II (NEII) and NASA's Blue Marble Next Generation (BMNG) imagery. Its aim was to provide a basemap similar to NEII but with a higher resolution (~10x). This basemaps is derived from the following datasets: Blue Marble Next Generation 2004-04 (NASA), VMap0 coastline, Coast100k 2004 Australian coastline (GeoScience Australia), SRTM30 Plus v8.0 (UCSD) hillshading, Natural Earth Vector 10m bathymetry and coastline v2.0 (NE), gbr100 hillshading (JCU). This dataset (World_Bright-Earth-e-Atlas-basemap) contains all the files required to setup the Bright Earth eAtlas basemap in a GeoServer. All the data files are stored in GeoTiffs or shapefiles and so can also be loaded into ArcMap, however no styling has been included for this purpose.
-
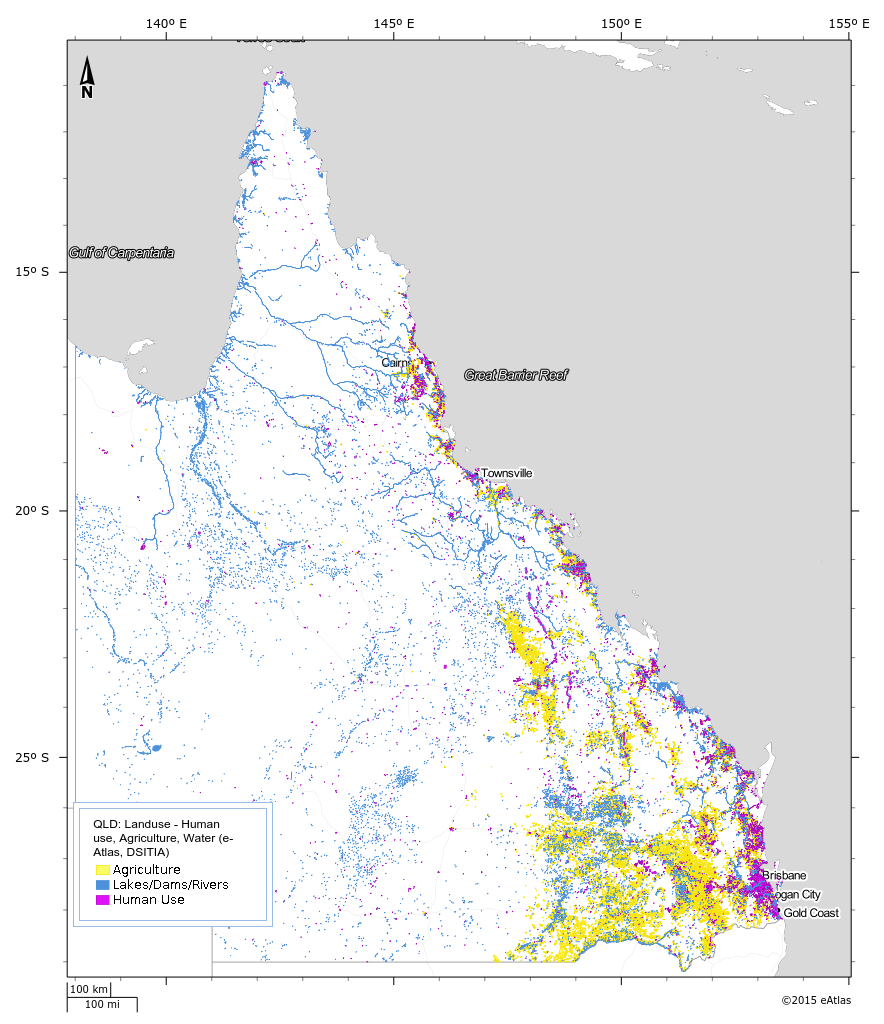
This dataset is subset and aggregation of the current Queensland land use dataset (1999 - 2012) by Queensland Land Use Mapping Program (QLUMP) produced by the Queensland Government. The land use data was classified and aggregated into areas that represent Human Use, Agriculture and Water areas such as lakes and rivers.