Connectivity of North East Australia's Seascape Maps
This gallery highlights all the connectivity maps developed as part of NESP TWQ 3.3.3. The dataset used to create these maps is available.
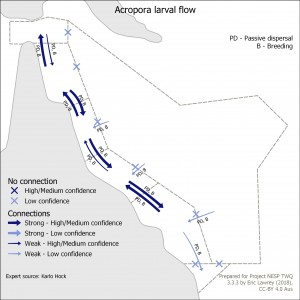
This map shows the connectivity of Acropora larval flow in the Great Barrier Reef and its surrounding areas: Torres Strait, Coral Sea and Great Sandy regions. The arrows indicate the strength and nature of the connection between the regions. This map is intended to identify where one region is dependent on a neighbouring region.
The data for this map was developed based on expert opinion (Karlo Hock).
 by NESP TWQ 3.3.3, Karlo Hock
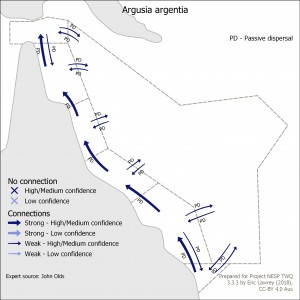
This map shows the connectivity of Argusia argentia in the Great Barrier Reef and its surrounding areas: Torres Strait, Coral Sea and Great Sandy regions. The arrows indicate the strength and nature of the connection between the regions. This map is intended to identify where one region is dependent on a neighbouring region.
Additional notes: This is an example of a ubiquitous vegetation species as opposed to a more restricited sp. (e.g. Pisonia grandis). Argusia has a floating seed and is a pioneer species of foredunes and cays. It is dependant on currents for direction of dispersal.
The data for this map was developed based on expert opinion (John Olds).
 by NESP TWQ 3.3.3, John Olds
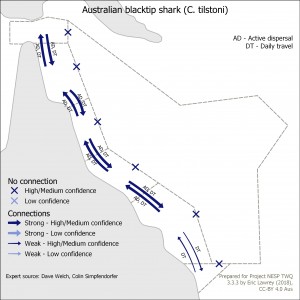
This map shows the connectivity of Australian blacktip shark (C. tilstoni) in the Great Barrier Reef and its surrounding areas: Torres Strait, Coral Sea and Great Sandy regions. The arrows indicate the strength and nature of the connection between the regions. This map is intended to identify where one region is dependent on a neighbouring region.
Additional notes: This map does not show the connectivity between subregions of the GBR but only with its surrounding regions.
The data for this map was developed based on expert opinion (Dave Welch, Colin Simpfendorfer).
 by NESP TWQ 3.3.3, Dave Welch, Colin Simpfendorfer
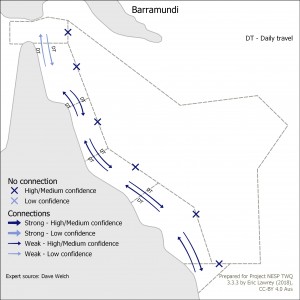
This map shows the connectivity of Barramundi in the Great Barrier Reef and its surrounding areas: Torres Strait, Coral Sea and Great Sandy regions. The arrows indicate the strength and nature of the connection between the regions. This map is intended to identify where one region is dependent on a neighbouring region.
Additional notes: This map does not show the connectivity between subregions of the GBR but only with its surrounding regions.
The data for this map was developed based on expert opinion (Dave Welch).
 by NESP TWQ 3.3.3, Dave Welch
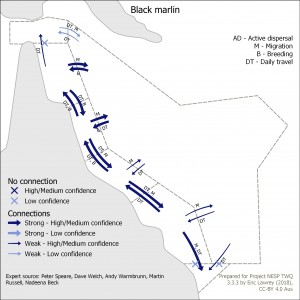
This map shows the connectivity of Black marlin in the Great Barrier Reef and its surrounding areas: Torres Strait, Coral Sea and Great Sandy regions. The arrows indicate the strength and nature of the connection between the regions. This map is intended to identify where one region is dependent on a neighbouring region.
Additional notes: Active dispersal from reproductive animals greater than 10 years old. Annual breeding area near Lizard Island/Ribbon reefs. Adults disperse. Juveniles tend to migrate south through the GBR and further. For additional Coral Sea and North Australia content please reference: Expert source: Parks Australia staff - Andy Warmbrunn, Martin Russell, Nadeena Beck. Supporting data: submissions to Australian Marine Park Management plan consultation
The data for this map was developed based on expert opinion (Peter Speare, Dave Welch, Andy Warmbrunn, Martin Russell, Nadeena Beck).
 by NESP TWQ 3.3.3, Peter Speare, Dave Welch, Andy Warmbrunn, Martin Russell, Nadeena Beck
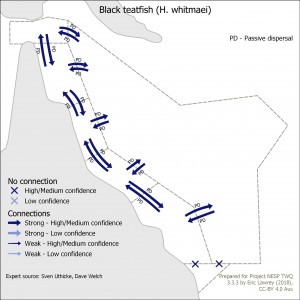
This map shows the connectivity of Black teatfish (H. whitmaei) in the Great Barrier Reef and its surrounding areas: Torres Strait, Coral Sea and Great Sandy regions. The arrows indicate the strength and nature of the connection between the regions. This map is intended to identify where one region is dependent on a neighbouring region.
Additional notes: Present in all areas except Sandy Strait in the south. Highly connected species. No adult migration, all connection is through passive larval dispersion.
The data for this map was developed based on expert opinion (Sven Uthicke, Dave Welch).
 by NESP TWQ 3.3.3, Sven Uthicke, Dave Welch
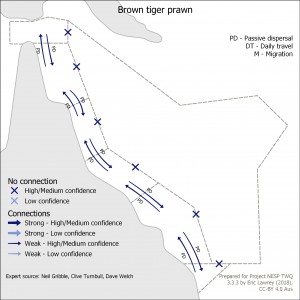
This map shows the connectivity of Brown tiger prawn in the Great Barrier Reef and its surrounding areas: Torres Strait, Coral Sea and Great Sandy regions. The arrows indicate the strength and nature of the connection between the regions. This map is intended to identify where one region is dependent on a neighbouring region.
Additional notes: This map does not show the connectivity between subregions of the GBR but only with its surrounding regions.
The data for this map was developed based on expert opinion (Neil Gribble, Clive Turnbull, Dave Welch).
 by NESP TWQ 3.3.3, Neil Gribble, Clive Turnbull, Dave Welch
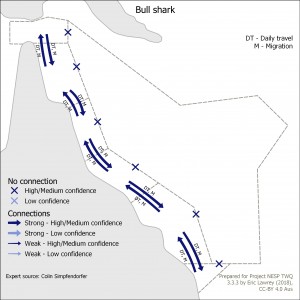
This map shows the connectivity of Bull shark in the Great Barrier Reef and its surrounding areas: Torres Strait, Coral Sea and Great Sandy regions. The arrows indicate the strength and nature of the connection between the regions. This map is intended to identify where one region is dependent on a neighbouring region.
Additional notes: This map does not show the connectivity between subregions of the GBR but only with its surrounding regions.
The data for this map was developed based on expert opinion (Colin Simpfendorfer).
 by NESP TWQ 3.3.3, Colin Simpfendorfer
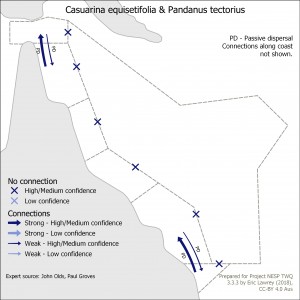
This map shows the connectivity of Casuarina equisetifolia & Pandanus tectorius in the Great Barrier Reef and its surrounding areas: Torres Strait, Coral Sea and Great Sandy regions. The arrows indicate the strength and nature of the connection between the regions. This map is intended to identify where one region is dependent on a neighbouring region.
Additional notes: These are coral cay vegetation pioneer species. This map only shows the connectivity between the GBR and surrounding regions and not regions along the Queensland coast.
The data for this map was developed based on expert opinion (John Olds, Paul Groves).
 by NESP TWQ 3.3.3, John Olds, Paul Groves
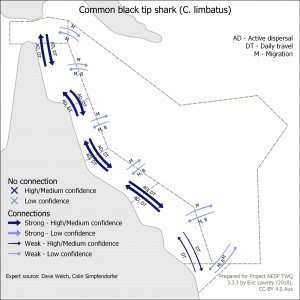
This map shows the connectivity of Common black tip shark (C. limbatus) in the Great Barrier Reef and its surrounding areas: Torres Strait, Coral Sea and Great Sandy regions. The arrows indicate the strength and nature of the connection between the regions. This map is intended to identify where one region is dependent on a neighbouring region.
Additional notes: This map does not show the connectivity between subregions of the GBR but only with its surrounding regions.
The data for this map was developed based on expert opinion (Dave Welch, Colin Simpfendorfer).
 by NESP TWQ 3.3.3, Dave Welch, Colin Simpfendorfer
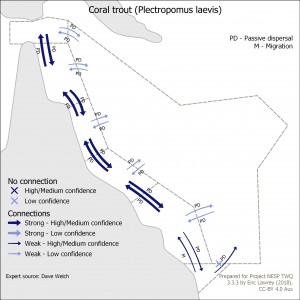
This map shows the connectivity of Coral trout (Plectropomus laevis) in the Great Barrier Reef and its surrounding areas: Torres Strait, Coral Sea and Great Sandy regions. The arrows indicate the strength and nature of the connection between the regions. This map is intended to identify where one region is dependent on a neighbouring region.
Additional notes: This map does not show the connectivity between subregions of the GBR but only with its surrounding regions.
The data for this map was developed based on expert opinion (Dave Welch).
 by NESP TWQ 3.3.3, Dave Welch
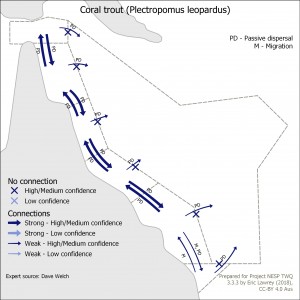
This map shows the connectivity of Coral trout (Plectropomus leopardus) in the Great Barrier Reef and its surrounding areas: Torres Strait, Coral Sea and Great Sandy regions. The arrows indicate the strength and nature of the connection between the regions. This map is intended to identify where one region is dependent on a neighbouring region.
Additional notes: This map does not show the connectivity between subregions of the GBR but only with its surrounding regions.
The data for this map was developed based on expert opinion (Dave Welch).
 by NESP TWQ 3.3.3, Dave Welch
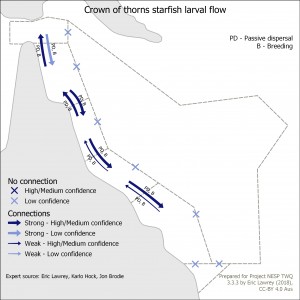
This map shows the connectivity of Crown of thorns starfish larval flow in the Great Barrier Reef and its surrounding areas: Torres Strait, Coral Sea and Great Sandy regions. The arrows indicate the strength and nature of the connection between the regions. This map is intended to identify where one region is dependent on a neighbouring region.
Additional notes: This map is based on connectivity estimates from eReefs hydrodynamic modelling and measured COTS outbreak patterns.
The data for this map was developed based on expert opinion (Eric Lawrey, Karlo Hock, Jon Brodie).
 by NESP TWQ 3.3.3, Eric Lawrey, Karlo Hock, Jon Brodie
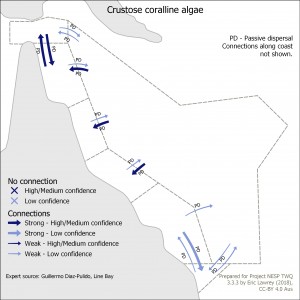
This map shows the connectivity of Crustose coralline algae in the Great Barrier Reef and its surrounding areas: Torres Strait, Coral Sea and Great Sandy regions. The arrows indicate the strength and nature of the connection between the regions. This map is intended to identify where one region is dependent on a neighbouring region.
Additional notes: Passive dispersal by spore reproduction throughout year. Lots of crytic species. Taxonomy mostly unknown. This map only shows the connectivity between the GBR and surrounding regions and not regions along the Queensland coast.
The data for this map was developed based on expert opinion (Guillermo Diaz-Pulido, Line Bay).
 by NESP TWQ 3.3.3, Guillermo Diaz-Pulido, Line Bay
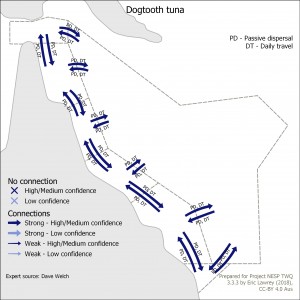
This map shows the connectivity of Dogtooth tuna in the Great Barrier Reef and its surrounding areas: Torres Strait, Coral Sea and Great Sandy regions. The arrows indicate the strength and nature of the connection between the regions. This map is intended to identify where one region is dependent on a neighbouring region.
Additional notes: This map does not show the connectivity between subregions of the GBR but only with its surrounding regions.
The data for this map was developed based on expert opinion (Dave Welch).
 by NESP TWQ 3.3.3, Dave Welch
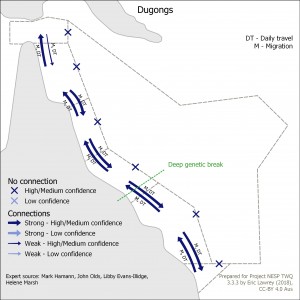
This map shows the connectivity of Dugongs in the Great Barrier Reef and its surrounding areas: Torres Strait, Coral Sea and Great Sandy regions. The arrows indicate the strength and nature of the connection between the regions. This map is intended to identify where one region is dependent on a neighbouring region.
The data for this map was developed based on expert opinion (Mark Hamann, John Olds, Libby Evans-Illidge, Helene Marsh).
 by NESP TWQ 3.3.3, Mark Hamann, John Olds, Libby Evans-Illidge, Helene Marsh
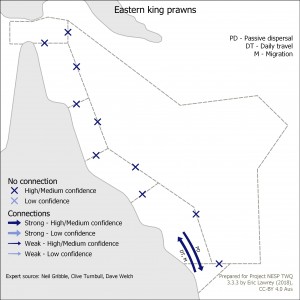
This map shows the connectivity of Eastern king prawns in the Great Barrier Reef and its surrounding areas: Torres Strait, Coral Sea and Great Sandy regions. The arrows indicate the strength and nature of the connection between the regions. This map is intended to identify where one region is dependent on a neighbouring region.
The data for this map was developed based on expert opinion (Neil Gribble, Clive Turnbull, Dave Welch).
 by NESP TWQ 3.3.3, Neil Gribble, Clive Turnbull, Dave Welch
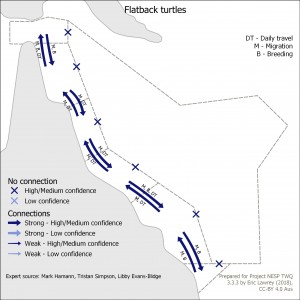
This map shows the connectivity of Flatback turtles in the Great Barrier Reef and its surrounding areas: Torres Strait, Coral Sea and Great Sandy regions. The arrows indicate the strength and nature of the connection between the regions. This map is intended to identify where one region is dependent on a neighbouring region.
Additional notes: Flatback turtles from GBR migrate north and south through the GBR/ There is also strong connections from Torres Strait to the Gulf of Carpentaria, Northern Territory and Western Australia and from Great Sandy to South Each Queensland.
The data for this map was developed based on expert opinion (Mark Hamann, Tristan Simpson, Libby Evans-Illidge).
 by NESP TWQ 3.3.3, Mark Hamann, Tristan Simpson, Libby Evans-Illidge
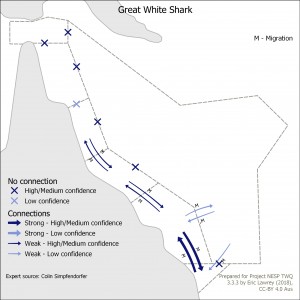
This map shows the connectivity of Great White Shark in the Great Barrier Reef and its surrounding areas: Torres Strait, Coral Sea and Great Sandy regions. The arrows indicate the strength and nature of the connection between the regions. This map is intended to identify where one region is dependent on a neighbouring region.
Additional notes: Northern migration is strongly associated with humpback whale movement. As a result they tend to stay nearshore.
The data for this map was developed based on expert opinion (Colin Simpfendorfer).
 by NESP TWQ 3.3.3, Colin Simpfendorfer
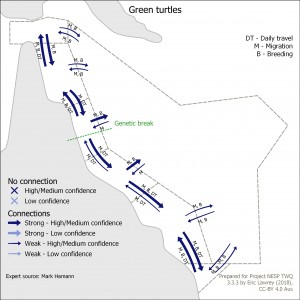
This map shows the connectivity of Green turtles in the Great Barrier Reef and its surrounding areas: Torres Strait, Coral Sea and Great Sandy regions. The arrows indicate the strength and nature of the connection between the regions. This map is intended to identify where one region is dependent on a neighbouring region.
Additional notes: All movements for migration. Turtles live in foraging areas 90% of time.
The data for this map was developed based on expert opinion (Mark Hamann).
 by NESP TWQ 3.3.3, Mark Hamann
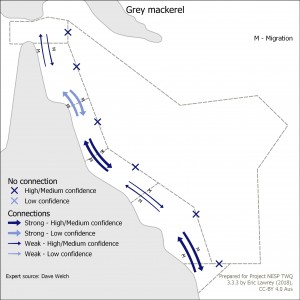
This map shows the connectivity of Grey mackerel in the Great Barrier Reef and its surrounding areas: Torres Strait, Coral Sea and Great Sandy regions. The arrows indicate the strength and nature of the connection between the regions. This map is intended to identify where one region is dependent on a neighbouring region.
Additional notes: This map does not show the connectivity between subregions of the GBR but only with its surrounding regions.
The data for this map was developed based on expert opinion (Dave Welch).
 by NESP TWQ 3.3.3, Dave Welch
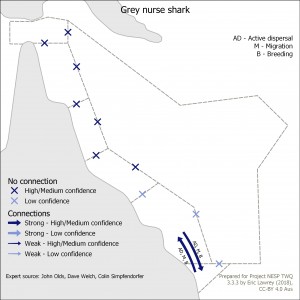
This map shows the connectivity of Grey nurse shark in the Great Barrier Reef and its surrounding areas: Torres Strait, Coral Sea and Great Sandy regions. The arrows indicate the strength and nature of the connection between the regions. This map is intended to identify where one region is dependent on a neighbouring region.
The data for this map was developed based on expert opinion (John Olds, Dave Welch, Colin Simpfendorfer).
 by NESP TWQ 3.3.3, John Olds, Dave Welch, Colin Simpfendorfer
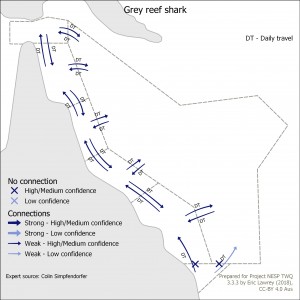
This map shows the connectivity of Grey reef shark in the Great Barrier Reef and its surrounding areas: Torres Strait, Coral Sea and Great Sandy regions. The arrows indicate the strength and nature of the connection between the regions. This map is intended to identify where one region is dependent on a neighbouring region.
Additional notes: This map does not show the connectivity between subregions of the GBR but only with its surrounding regions.
The data for this map was developed based on expert opinion (Colin Simpfendorfer).
 by NESP TWQ 3.3.3, Colin Simpfendorfer
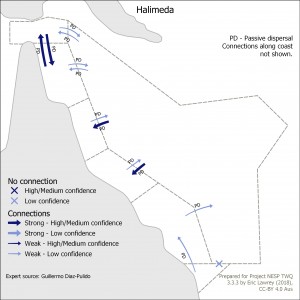
This map shows the connectivity of Halimeda in the Great Barrier Reef and its surrounding areas: Torres Strait, Coral Sea and Great Sandy regions. The arrows indicate the strength and nature of the connection between the regions. This map is intended to identify where one region is dependent on a neighbouring region.
Additional notes: There is no data for the Great Sandy region.
The data for this map was developed based on expert opinion (Guillermo Diaz-Pulido).
 by NESP TWQ 3.3.3, Guillermo Diaz-Pulido
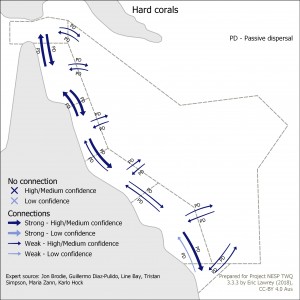
This map shows the connectivity of Hard corals in the Great Barrier Reef and its surrounding areas: Torres Strait, Coral Sea and Great Sandy regions. The arrows indicate the strength and nature of the connection between the regions. This map is intended to identify where one region is dependent on a neighbouring region.
Additional notes: Demographic connectivity uncertain (based on genetic data).
The data for this map was developed based on expert opinion (Jon Brodie, Guillermo Diaz-Pulido, Line Bay, Tristan Simpson, Maria Zann, Karlo Hock).
 by NESP TWQ 3.3.3, Jon Brodie, Guillermo Diaz-Pulido, Line Bay, Tristan Simpson, Maria Zann, Karlo Hock
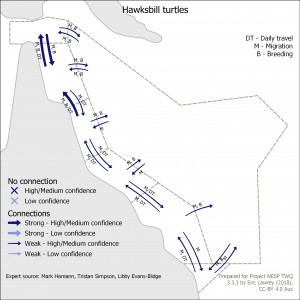
This map shows the connectivity of Hawksbill turtles in the Great Barrier Reef and its surrounding areas: Torres Strait, Coral Sea and Great Sandy regions. The arrows indicate the strength and nature of the connection between the regions. This map is intended to identify where one region is dependent on a neighbouring region.
Additional notes: Breeding sites in far north GBR and Torres Strait (Sassie Island, Au Kein Islet, Mimi Island, Aureed Island). Breeding in New Caledonia and Solomon Islands. There is also a strong connection from Torres Strait into the Gulf of Carpentaria.
The data for this map was developed based on expert opinion (Mark Hamann, Tristan Simpson, Libby Evans-Illidge).
 by NESP TWQ 3.3.3, Mark Hamann, Tristan Simpson, Libby Evans-Illidge
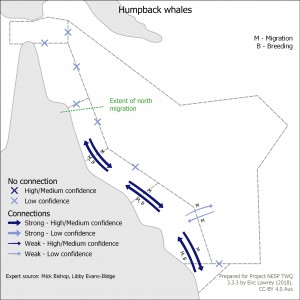
This map shows the connectivity of Humpback whales in the Great Barrier Reef and its surrounding areas: Torres Strait, Coral Sea and Great Sandy regions. The arrows indicate the strength and nature of the connection between the regions. This map is intended to identify where one region is dependent on a neighbouring region.
The data for this map was developed based on expert opinion (Mick Bishop, Libby Evans-Illidge).
 by NESP TWQ 3.3.3, Mick Bishop, Libby Evans-Illidge
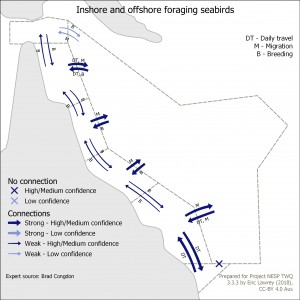
This map shows the connectivity of Inshore and offshore foraging seabirds in the Great Barrier Reef and its surrounding areas: Torres Strait, Coral Sea and Great Sandy regions. The arrows indicate the strength and nature of the connection between the regions. This map is intended to identify where one region is dependent on a neighbouring region.
Additional notes: Example species: boobies, terns (not sooties or bridles), noddies.
The data for this map was developed based on expert opinion (Brad Congdon).
 by NESP TWQ 3.3.3, Brad Congdon
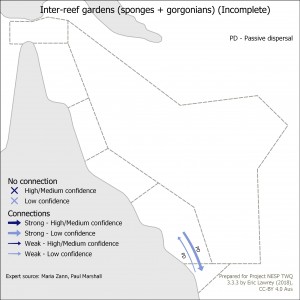
This map shows the connectivity of Inter-reef gardens (sponges + gorgonians) (Incomplete) in the Great Barrier Reef and its surrounding areas: Torres Strait, Coral Sea and Great Sandy regions. The arrows indicate the strength and nature of the connection between the regions. This map is intended to identify where one region is dependent on a neighbouring region.
Additional notes: This map is in-complete due to lack of knowledge about the connectivity between the inter-reefal habitats. Distribution of sponges and octocorals beyond GBR not well known. Life histories also not well known. The connectivity shown in the map is based on assumptions of strong northerly wind driven currents and the assumption that most spawning occurs Oct - Dec.
The data for this map was developed based on expert opinion (Maria Zann, Paul Marshall).
 by NESP TWQ 3.3.3, Maria Zann, Paul Marshall
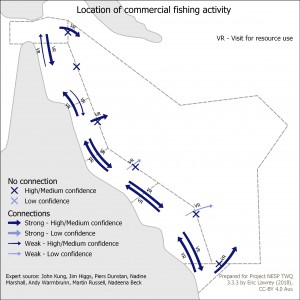
This map shows the connectivity of Location of commercial fishing activity in the Great Barrier Reef and its surrounding areas: Torres Strait, Coral Sea and Great Sandy regions. The arrows indicate the strength and nature of the connection between the regions. This map is intended to identify where one region is dependent on a neighbouring region.
Additional notes: Example: Great Sandy to Coral Sea for longline trawling. For additional Coral Sea and North Australia content please reference: Expert source: Parks Australia staff - Andy Warmbrunn, Martin Russell, Nadeena Beck. Supporting data: submissions to Australian Marine Park Management plan consultation.
The data for this map was developed based on expert opinion (John Kung, Jim Higgs, Piers Dunstan, Nadine Marshall, Andy Warmbrunn, Martin Russell, Nadeena Beck).
 by NESP TWQ 3.3.3, John Kung, Jim Higgs, Piers Dunstan, Nadine Marshall, Andy Warmbrunn, Martin Russell, Nadeena Beck


