Connectivity of North East Australia's Seascape Maps
This gallery highlights all the connectivity maps developed as part of NESP TWQ 3.3.3. The dataset used to create these maps is available.
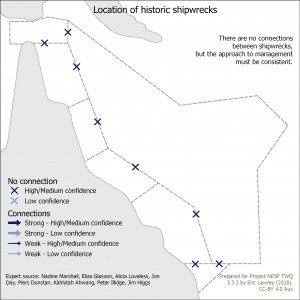
This map shows the connectivity of Location of historic shipwrecks in the Great Barrier Reef and its surrounding areas: Torres Strait, Coral Sea and Great Sandy regions. The arrows indicate the strength and nature of the connection between the regions. This map is intended to identify where one region is dependent on a neighbouring region.
Additional notes: The shipwrecks are not connected because they don't move.
The data for this map was developed based on expert opinion (Nadine Marshall, Eliza Glasson, Alicia Loveless, Jon Day, Piers Dunstan, Kahlytah Ahwang, Peter Illidge, Jim Higgs).
 by NESP TWQ 3.3.3, Nadine Marshall, Eliza Glasson, Alicia Loveless, Jon Day, Piers Dunstan, Kahlytah Ahwang, Peter Illidge, Jim Higgs
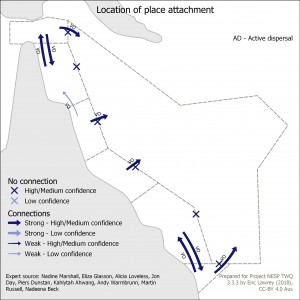
This map shows the connectivity of Location of place attachment in the Great Barrier Reef and its surrounding areas: Torres Strait, Coral Sea and Great Sandy regions. The arrows indicate the strength and nature of the connection between the regions. This map is intended to identify where one region is dependent on a neighbouring region.
Additional notes: Place attachment refers to places that people are particularly connected to. These places may be special across jurisdictional boundaries because of (i) attractive or meaningful features within the natural landscape (that cross boundaries), (ii) the strong social bonds and networks that exist within such places, such as family and friends, and (iii) special events that may have occurred across jurisdictions, such as celebrations, funerals, hunting expeditions or special recreational outings. An example is connections with the Coral Sea from the launch of vessels associated with the Battle of the Coral Sea during World War II.
The data for this map was developed based on expert opinion (Nadine Marshall, Eliza Glasson, Alicia Loveless, Jon Day, Piers Dunstan, Kahlytah Ahwang, Andy Warmbrunn, Martin Russell, Nadeena Beck).
 by NESP TWQ 3.3.3, Nadine Marshall, Eliza Glasson, Alicia Loveless, Jon Day, Piers Dunstan, Kahlytah Ahwang, Andy Warmbrunn, Martin Russell, Nadeena Beck
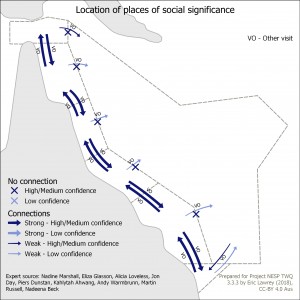
This map shows the connectivity of Location of places of social significance in the Great Barrier Reef and its surrounding areas: Torres Strait, Coral Sea and Great Sandy regions. The arrows indicate the strength and nature of the connection between the regions. This map is intended to identify where one region is dependent on a neighbouring region.
Additional notes: Places of social significance that cross jurisdictional boundaries are sites that people recognise as having important social, cultural or traditional heritage such as initiation sites, hunting grounds, or places that people visit regularly. For additional Coral Sea and North Australia content please reference: Expert source: Parks Australia staff - Andy Warmbrunn, Martin Russell, Nadeena Beck. Supporting data: submissions to Australian Marine Park Management plan consultation
The data for this map was developed based on expert opinion (Nadine Marshall, Eliza Glasson, Alicia Loveless, Jon Day, Piers Dunstan, Kahlytah Ahwang, Andy Warmbrunn, Martin Russell, Nadeena Beck).
 by NESP TWQ 3.3.3, Nadine Marshall, Eliza Glasson, Alicia Loveless, Jon Day, Piers Dunstan, Kahlytah Ahwang, Andy Warmbrunn, Martin Russell, Nadeena Beck
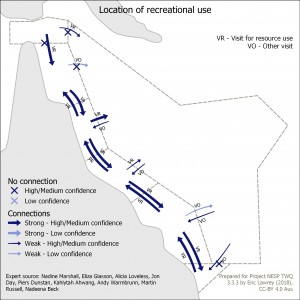
This map shows the connectivity of Location of recreational use in the Great Barrier Reef and its surrounding areas: Torres Strait, Coral Sea and Great Sandy regions. The arrows indicate the strength and nature of the connection between the regions. This map is intended to identify where one region is dependent on a neighbouring region.
Additional notes: Examples: Torres Strait to Coral Sea for charter fishing and GBR Mackay/Capricorn to Coral Sea from cruise ships. Arrows going towards the coast are due to international boats travelling through the Coral Sea to the Queensland Ports. For additional Coral Sea and North Australia content please reference: Expert source: Parks Australia staff - Andy Warmbrunn, Martin Russell, Nadeena Beck. Supporting data: submissions to Australian Marine Park Management plan consultation.
The data for this map was developed based on expert opinion (Nadine Marshall, Eliza Glasson, Alicia Loveless, Jon Day, Piers Dunstan, Kahlytah Ahwang, Andy Warmbrunn, Martin Russell, Nadeena Beck).
 by NESP TWQ 3.3.3, Nadine Marshall, Eliza Glasson, Alicia Loveless, Jon Day, Piers Dunstan, Kahlytah Ahwang, Andy Warmbrunn, Martin Russell, Nadeena Beck
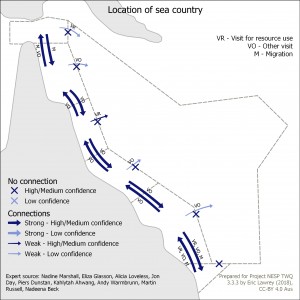
This map shows the connectivity of Location of sea country in the Great Barrier Reef and its surrounding areas: Torres Strait, Coral Sea and Great Sandy regions. The arrows indicate the strength and nature of the connection between the regions. This map is intended to identify where one region is dependent on a neighbouring region.
Additional notes: For additional Coral Sea and North Australia content please reference: Expert source: Parks Australia staff - Andy Warmbrunn, Martin Russell, Nadeena Beck. Supporting data: submissions to Australian Marine Park Management plan consultation.
The data for this map was developed based on expert opinion (Nadine Marshall, Eliza Glasson, Alicia Loveless, Jon Day, Piers Dunstan, Kahlytah Ahwang, Andy Warmbrunn, Martin Russell, Nadeena Beck).
 by NESP TWQ 3.3.3, Nadine Marshall, Eliza Glasson, Alicia Loveless, Jon Day, Piers Dunstan, Kahlytah Ahwang, Andy Warmbrunn, Martin Russell, Nadeena Beck
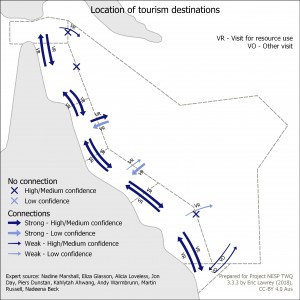
This map shows the connectivity of Location of tourism destinations in the Great Barrier Reef and its surrounding areas: Torres Strait, Coral Sea and Great Sandy regions. The arrows indicate the strength and nature of the connection between the regions. This map is intended to identify where one region is dependent on a neighbouring region.
Additional notes: Examples: Cruise ships from Great Sandy to the Coral Sea. For additional Coral Sea and North Australia content please reference: Expert source: Parks Australia staff - Andy Warmbrunn, Martin Russell, Nadeena Beck. Supporting data: submissions to Australian Marine Park Management plan consultation.
The data for this map was developed based on expert opinion (Nadine Marshall, Eliza Glasson, Alicia Loveless, Jon Day, Piers Dunstan, Kahlytah Ahwang, Andy Warmbrunn, Martin Russell, Nadeena Beck).
 by NESP TWQ 3.3.3, Nadine Marshall, Eliza Glasson, Alicia Loveless, Jon Day, Piers Dunstan, Kahlytah Ahwang, Andy Warmbrunn, Martin Russell, Nadeena Beck
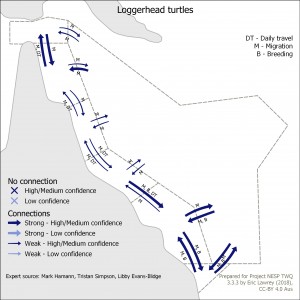
This map shows the connectivity of Loggerhead turtles in the Great Barrier Reef and its surrounding areas: Torres Strait, Coral Sea and Great Sandy regions. The arrows indicate the strength and nature of the connection between the regions. This map is intended to identify where one region is dependent on a neighbouring region.
Additional notes: There is no breeding in the far north. Breeding sites are in the Mackay / Capricorn and Great Sandy regions. There is also a strong connection with Moreton Bay from the Great Sandy region, to New Caledonia from the Coral Sea and from Torres Strait to Gulf of Carpentaria and Western Australia.
The data for this map was developed based on expert opinion (Mark Hamann, Tristan Simpson, Libby Evans-Illidge).
 by NESP TWQ 3.3.3, Mark Hamann, Tristan Simpson, Libby Evans-Illidge
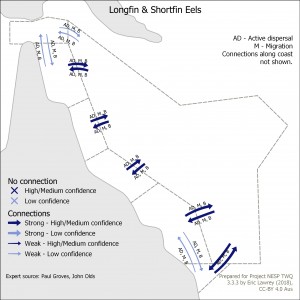
This map shows the connectivity of Longfin & Shortfin Eels in the Great Barrier Reef and its surrounding areas: Torres Strait, Coral Sea and Great Sandy regions. The arrows indicate the strength and nature of the connection between the regions. This map is intended to identify where one region is dependent on a neighbouring region.
Additional notes: This map does not show the connectivity between subregions of the GBR but only with its surrounding regions.
The data for this map was developed based on expert opinion (Paul Groves, John Olds).
 by NESP TWQ 3.3.3, Paul Groves, John Olds
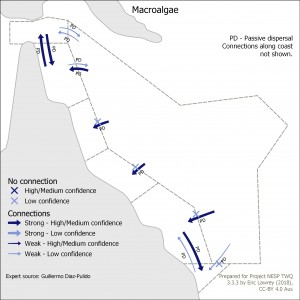
This map shows the connectivity of Macroalgae in the Great Barrier Reef and its surrounding areas: Torres Strait, Coral Sea and Great Sandy regions. The arrows indicate the strength and nature of the connection between the regions. This map is intended to identify where one region is dependent on a neighbouring region.
Additional notes: This map only shows the connectivity between the GBR and surrounding regions and not regions along the Queensland coast.
The data for this map was developed based on expert opinion (Guillermo Diaz-Pulido).
 by NESP TWQ 3.3.3, Guillermo Diaz-Pulido
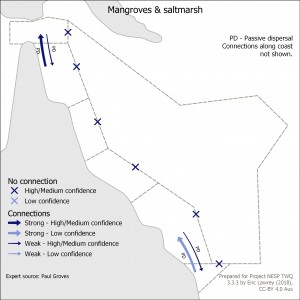
This map shows the connectivity of Mangroves & saltmarsh in the Great Barrier Reef and its surrounding areas: Torres Strait, Coral Sea and Great Sandy regions. The arrows indicate the strength and nature of the connection between the regions. This map is intended to identify where one region is dependent on a neighbouring region.
Additional notes: This map only shows the connectivity between the GBR and surrounding regions and not regions along the Queensland coast.
The data for this map was developed based on expert opinion (Paul Groves).
 by NESP TWQ 3.3.3, Paul Groves
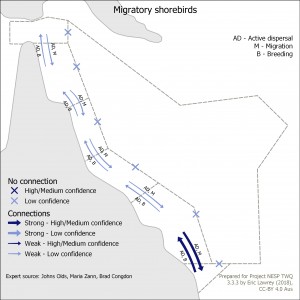
This map shows the connectivity of Migratory shorebirds in the Great Barrier Reef and its surrounding areas: Torres Strait, Coral Sea and Great Sandy regions. The arrows indicate the strength and nature of the connection between the regions. This map is intended to identify where one region is dependent on a neighbouring region.
Additional notes: Example species: Eastern curlew, knots, plovers, gotwit. These species breed in the northern hemisphere.
The data for this map was developed based on expert opinion (Johns Olds, Maria Zann, Brad Congdon).
 by NESP TWQ 3.3.3, Johns Olds, Maria Zann, Brad Congdon
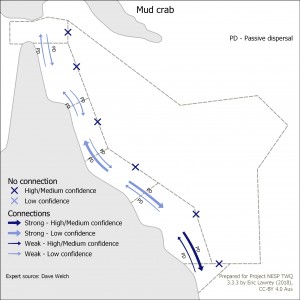
This map shows the connectivity of Mud crab in the Great Barrier Reef and its surrounding areas: Torres Strait, Coral Sea and Great Sandy regions. The arrows indicate the strength and nature of the connection between the regions. This map is intended to identify where one region is dependent on a neighbouring region.
Additional notes: This map does not show the connectivity between subregions of the GBR but only with its surrounding regions.
The data for this map was developed based on expert opinion (Dave Welch).
 by NESP TWQ 3.3.3, Dave Welch
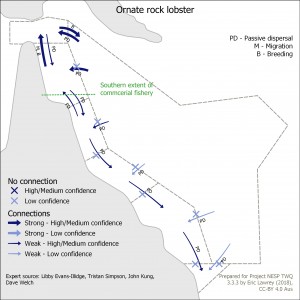
This map shows the connectivity of Ornate rock lobster in the Great Barrier Reef and its surrounding areas: Torres Strait, Coral Sea and Great Sandy regions. The arrows indicate the strength and nature of the connection between the regions. This map is intended to identify where one region is dependent on a neighbouring region.
Additional notes: The ornate rock lobster makes a walking migration around the Gulf of Papua where they spawn. Larvae then drift back to the far northern region of Queensland with the ocean currents.
The data for this map was developed based on expert opinion (Libby Evans-Illidge, Tristan Simpson, John Kung, Dave Welch).
 by NESP TWQ 3.3.3, Libby Evans-Illidge, Tristan Simpson, John Kung, Dave Welch
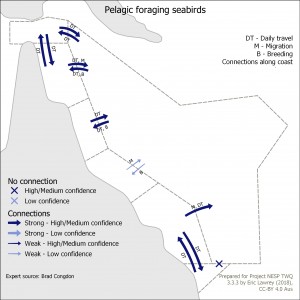
This map shows the connectivity of Pelagic foraging seabirds in the Great Barrier Reef and its surrounding areas: Torres Strait, Coral Sea and Great Sandy regions. The arrows indicate the strength and nature of the connection between the regions. This map is intended to identify where one region is dependent on a neighbouring region.
Additional notes: This map highlights the connectivity for Wedge-tailed shearwaters, sooty terns and bridled terns. Shearwaters migrate to Guam, others are unknown.
The data for this map was developed based on expert opinion (Brad Congdon).
 by NESP TWQ 3.3.3, Brad Congdon
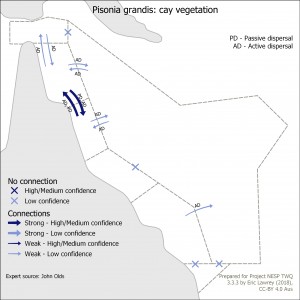
This map shows the connectivity of Pisonia grandis: cay vegetation in the Great Barrier Reef and its surrounding areas: Torres Strait, Coral Sea and Great Sandy regions. The arrows indicate the strength and nature of the connection between the regions. This map is intended to identify where one region is dependent on a neighbouring region.
Additional notes: Active dispersal occurs when seed stick to bird feathers. Passive dispersal is via water.
The data for this map was developed based on expert opinion (John Olds).
 by NESP TWQ 3.3.3, John Olds
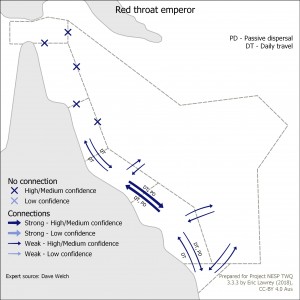
This map shows the connectivity of Red throat emperor in the Great Barrier Reef and its surrounding areas: Torres Strait, Coral Sea and Great Sandy regions. The arrows indicate the strength and nature of the connection between the regions. This map is intended to identify where one region is dependent on a neighbouring region.
Additional notes: This map does not show the connectivity between subregions of the GBR but only with its surrounding regions.
The data for this map was developed based on expert opinion (Dave Welch).
 by NESP TWQ 3.3.3, Dave Welch
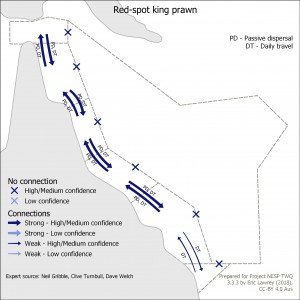
This map shows the connectivity of Red-spot king prawn in the Great Barrier Reef and its surrounding areas: Torres Strait, Coral Sea and Great Sandy regions. The arrows indicate the strength and nature of the connection between the regions. This map is intended to identify where one region is dependent on a neighbouring region.
Additional notes: The Great Sandy region is the lower bounds of the extent. This map does not show the connectiviy between subregions of the GBR, only the GBR and its surrounding regions.
The data for this map was developed based on expert opinion (Neil Gribble, Clive Turnbull, Dave Welch).
 by NESP TWQ 3.3.3, Neil Gribble, Clive Turnbull, Dave Welch
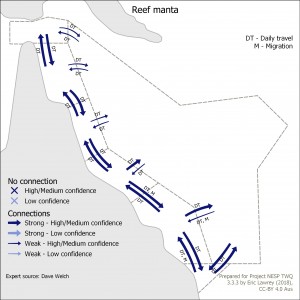
This map shows the connectivity of Reef manta in the Great Barrier Reef and its surrounding areas: Torres Strait, Coral Sea and Great Sandy regions. The arrows indicate the strength and nature of the connection between the regions. This map is intended to identify where one region is dependent on a neighbouring region.
Additional notes: This map does not show the connectivity between subregions of the GBR but only with its surrounding regions.
The data for this map was developed based on expert opinion (Dave Welch).
 by NESP TWQ 3.3.3, Dave Welch
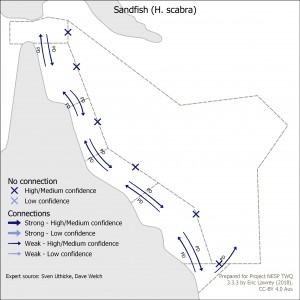
This map shows the connectivity of Sandfish (H. scabra) in the Great Barrier Reef and its surrounding areas: Torres Strait, Coral Sea and Great Sandy regions. The arrows indicate the strength and nature of the connection between the regions. This map is intended to identify where one region is dependent on a neighbouring region.
Additional notes: Not known if there are populations in Coral Sea. Connectivity through larval stage. This map does not show the connectivity between subregions of the GBR but only with its surrounding regions.
The data for this map was developed based on expert opinion (Sven Uthicke, Dave Welch).
 by NESP TWQ 3.3.3, Sven Uthicke, Dave Welch
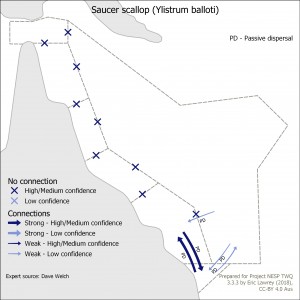
This map shows the connectivity of Saucer scallop (Ylistrum balloti) in the Great Barrier Reef and its surrounding areas: Torres Strait, Coral Sea and Great Sandy regions. The arrows indicate the strength and nature of the connection between the regions. This map is intended to identify where one region is dependent on a neighbouring region.
Additional notes: This map does not show the connectivity between subregions of the GBR but only with its surrounding regions.
The data for this map was developed based on expert opinion (Dave Welch).
 by NESP TWQ 3.3.3, Dave Welch
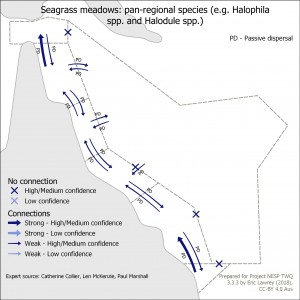
This map shows the connectivity of Seagrass meadows: pan-regional species (e.g. Halophila spp. and Halodule spp.) in the Great Barrier Reef and its surrounding areas: Torres Strait, Coral Sea and Great Sandy regions. The arrows indicate the strength and nature of the connection between the regions. This map is intended to identify where one region is dependent on a neighbouring region.
Additional notes: Most connectivity is characterised as passive dispersal. It is heavily dependent on oceanography, especially in second half of year. Seed dispersal is also assisted by dugong movement, but this is mostly restricted to within regions, except may be Great Sandy to Southern GBR and Torres Strait and far northern GBR.
The data for this map was developed based on expert opinion (Catherine Collier, Len McKenzie, Paul Marshall).
 by NESP TWQ 3.3.3, Catherine Collier, Len McKenzie, Paul Marshall
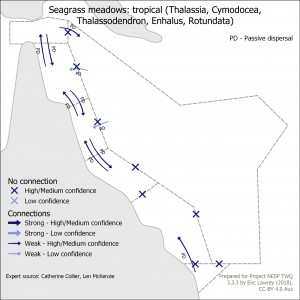
This map shows the connectivity of Seagrass meadows: tropical (Thalassia, Cymodocea, Thalassodendron, Enhalus, Rotundata) in the Great Barrier Reef and its surrounding areas: Torres Strait, Coral Sea and Great Sandy regions. The arrows indicate the strength and nature of the connection between the regions. This map is intended to identify where one region is dependent on a neighbouring region.
Additional notes: Torres Strait to GBR far northern connection is weak because probability is low, but the connection is important because it is the source.
The data for this map was developed based on expert opinion (Catherine Collier, Len McKenzie).
 by NESP TWQ 3.3.3, Catherine Collier, Len McKenzie
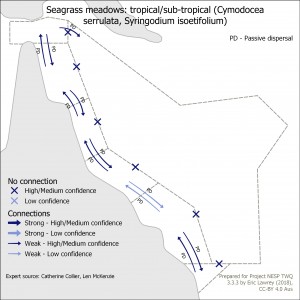
This map shows the connectivity of Seagrass meadows: tropical/sub-tropical (Cymodocea serrulata, Syringodium isoetifolium) in the Great Barrier Reef and its surrounding areas: Torres Strait, Coral Sea and Great Sandy regions. The arrows indicate the strength and nature of the connection between the regions. This map is intended to identify where one region is dependent on a neighbouring region.
Additional notes: Predominantly tropical with some isolated populations in subtropics.
The data for this map was developed based on expert opinion (Catherine Collier, Len McKenzie).
 by NESP TWQ 3.3.3, Catherine Collier, Len McKenzie
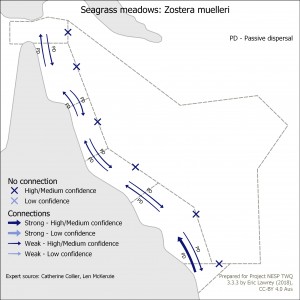
This map shows the connectivity of Seagrass meadows: Zostera muelleri in the Great Barrier Reef and its surrounding areas: Torres Strait, Coral Sea and Great Sandy regions. The arrows indicate the strength and nature of the connection between the regions. This map is intended to identify where one region is dependent on a neighbouring region.
Additional notes: This is predominantly temperate species which reaches distribution al northern limit in Torres Strait, so importence of weak connectivity from south to north. Vulnerable population in lower latitudes. Most connectivity is passive dispersal although megaherbivore may assist to a lesser degree.
The data for this map was developed based on expert opinion (Catherine Collier, Len McKenzie).
 by NESP TWQ 3.3.3, Catherine Collier, Len McKenzie
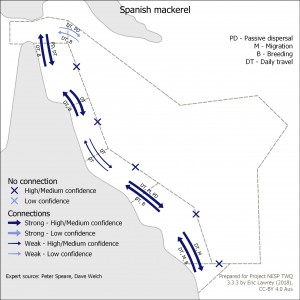
This map shows the connectivity of Spanish mackerel in the Great Barrier Reef and its surrounding areas: Torres Strait, Coral Sea and Great Sandy regions. The arrows indicate the strength and nature of the connection between the regions. This map is intended to identify where one region is dependent on a neighbouring region.
Additional notes: Torres Strait mackerel move into PNG waters but the extent that they move and are exploited in PNG waters is unknown. They spawn around Bramble cay and black rock in Torres Strait, and in the reefs east of Townsville. Torres Strait is only connected to Coral sea to the extent of Ashmore reef.
The data for this map was developed based on expert opinion (Peter Speare, Dave Welch).
 by NESP TWQ 3.3.3, Peter Speare, Dave Welch
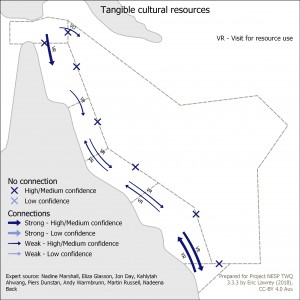
This map shows the connectivity of Tangible cultural resources in the Great Barrier Reef and its surrounding areas: Torres Strait, Coral Sea and Great Sandy regions. The arrows indicate the strength and nature of the connection between the regions. This map is intended to identify where one region is dependent on a neighbouring region.
Additional notes: This map captures the cuturally important resources (lobster, crayfish, turtle, dugong, trochus shell, dugong tusks) being moved by people into different regions for social capital. An example is the use of turtles in Ashmore reef (Coral Sea) from Torres Strait. For additional Coral Sea and North Australia content please reference: Expert source: Parks Australia staff - Andy Warmbrunn, Martin Russell, Nadeena Beck. Supporting data: submissions to Australian Marine Park Management plan consultation
The data for this map was developed based on expert opinion (Nadine Marshall, Eliza Glasson, Jon Day, Kahlytah Ahwang, Piers Dunstan, Andy Warmbrunn, Martin Russell, Nadeena Beck).
 by NESP TWQ 3.3.3, Nadine Marshall, Eliza Glasson, Jon Day, Kahlytah Ahwang, Piers Dunstan, Andy Warmbrunn, Martin Russell, Nadeena Beck
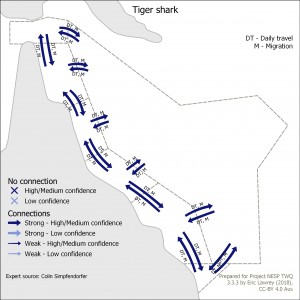
This map shows the connectivity of Tiger shark in the Great Barrier Reef and its surrounding areas: Torres Strait, Coral Sea and Great Sandy regions. The arrows indicate the strength and nature of the connection between the regions. This map is intended to identify where one region is dependent on a neighbouring region.
Additional notes: We don't know where breeding occurs.
The data for this map was developed based on expert opinion (Colin Simpfendorfer).
 by NESP TWQ 3.3.3, Colin Simpfendorfer
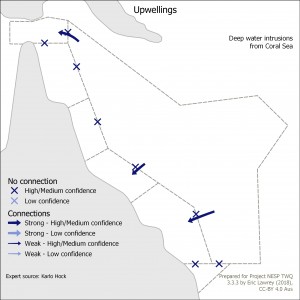
This map shows the connectivity of Upwellings in the Great Barrier Reef and its surrounding areas: Torres Strait, Coral Sea and Great Sandy regions. The arrows indicate the strength and nature of the connection between the regions. This map is intended to identify where one region is dependent on a neighbouring region.
The data for this map was developed based on expert opinion (Karlo Hock).
 by NESP TWQ 3.3.3, Karlo Hock
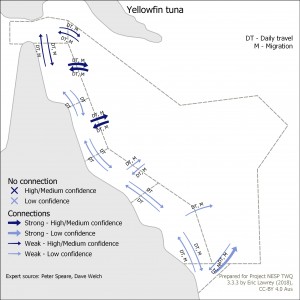
This map shows the connectivity of Yellowfin tuna in the Great Barrier Reef and its surrounding areas: Torres Strait, Coral Sea and Great Sandy regions. The arrows indicate the strength and nature of the connection between the regions. This map is intended to identify where one region is dependent on a neighbouring region.
The data for this map was developed based on expert opinion (Peter Speare, Dave Welch).
 by NESP TWQ 3.3.3, Peter Speare, Dave Welch


