
Nesting flatback turtle. Photo by Phillipa Wilson.
Flatback sea turtles (Natator depressus) are endemic to northern Australia and one of only two sea turtle species that are not distributed globally (7 species in total). Nesting occurs only on tropical Australian beaches, many in NW Australia’s remote Kimberley region. Under threat from coastal development, predation from feral animals and climate change, flatbacks are listed as a vulnerable species under the WA Biodiversity Conservation Act 2016 and the Commonwealth Environment Protection and Biodiversity Conservation Act 1999 and data deficient by the International Union for Conservation of Nature.
Surprisingly, little is known about what flatback turtles eat and what we do know comes from examining the stomach contents of dead flatback turtles. The Department of Parks and Wildlife has joined forces with WAMSI to try to answer this question through a 17 day field campaign to flatback turtle foraging grounds in the little known and relatively pristine tropical waters of north-west Australia’s remote Kimberly region. Scientists from Parks and Wildlife and the Australian Institute of Marine Science (AIMS) worked together in recent months to identify hotspots of flatback turtle foraging behaviour using data from satellite transmitting devices (tags) affixed to turtles (how it works) from eight WA nesting beaches (where are they?). Tracking data was supplied for this purpose from Chevron Australia, Pendoley Environmental, Parks and Wildlife, Woodside, Rio Tinto and BHP Billiton.
In mid October, a team of scientists from AIMS, CSIRO and the WA Museum will once again work with the dedicated crew of the RV Solander to map the seafloor depth with sonar, map benthic habitats using underwater video, and estimate biodiversity based on samples taken from the seafloor. These data will be used to create a habitat map of flatback turtle foraging areas. In addition, the team will collect a range of specimens of the small animals that live on the benthos, such as sea pens and soft corals that these turtles are thought to feed on. These samples will then be used in future work by the Department comparing certain chemical elements (e.g. carbon and nitrogen) in the prey with the same elements in the flatback turtle called ‘stable isotope analysis’. This analysis relies on the idea of ‘you are what you eat’, such that the stable isotopes of what we eat are represented in the tissues from our own bodies. Using such analyses, Park and Wildlife will be able to determine what creatures flatbacks are actually feeding on, information crucial for their management.
This is the last of five similar research expeditions conducted (or to be conducted) for WAMSI to map biodiversity in the region (see previous NW Atlas articles ‘In search of the biodiversity of remote NW Australia’s Kimberley region’ and ‘Turbid waters and exposed reefs: unlocking the secrets of the Kimberley coast’). The RV Solander (do a virtual tour) is scheduled to depart from Broome on 19 October 2016 and to return to Darwin on 4 November 2016.
Where do turtles spend the most time foraging?
So how do we know where flatback turtles forage? Australian Institute of Marine Science researchers used a combination of analyses on the turtle satellite tracking data to answer this question. First, the researchers determined where turtles were migrating and nesting versus foraging by using simple metrics like the speed and turning angle of the turtles along their tracks. Then, they created a regularly spaced grid of the Kimberley area and calculated the total time spent by turtles foraging in each grid cell. From this, they identified 'hotspots' where turtles spent the most time foraging (see below). The current survey will focus on Hotspot 3 (offshore from Broome, near Lynher Bank), followed by a shorter visit to Hotspot 2 (halfway between Broome and Darwin, offshore from Holothuria Banks) on our way to port in Darwin.

Hotspots of flatback turtle foraging time in NW Australia’s Kimberley region, 2008-2010.
What data will we collect?
Following on from previous WAMSI field campaigns scientists and crew of the RV Solander aim to:
- Map the depth of the ocean floor at a high resolution using a dual head multi-beam sonar,
- Characterise the benthos using towed video (see video below) along 1.5 km transect for each of a minimum of 50 sites (real-time assessment of community types, later assessment of infauna genera and species),
- Estimate species biodiversity by taking bottom samples of infauna along 50 to 100 metre transects (sleds - see movie below) for each of a minimum of 20 of the towed video sites,
- Retain samples of key benthic creatures for later isotope analysis, and
- Periodically measure water conductivity, salinity and temperature and take grab samples of the bottom.
We will also gather opportunistic turtle data by:
- Recording observations of where turtles are seen (or not seen) regularly,
- Where warranted, taking net samples of the water column as it seems turtles may eat jellyfish or other pelagic creatures in addition to benthic creatures.
The map below shows where we will sample in Hotspot 3 near Lynher Bank, with transect lines coloured based on classes of the duration of turtle foraging time (green – none, black – longest). As shown in the pie chart, most of the samples (76%) will be taken from areas where turtles have been observed to spend the most time foraging. Lynher Bank is located about 120 nautical miles north of Broome.
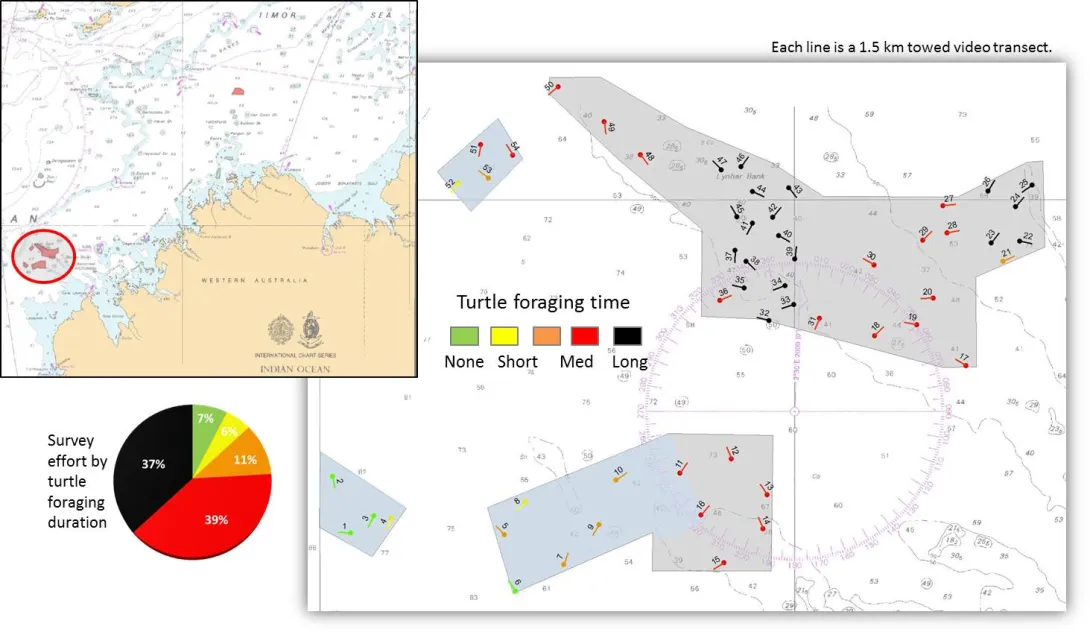
Plan for taking underwater video and sled samples near Lynher Bank.
Similarly, the map below shows where we will sample in Hotspot 2 which is located about 240 nautical miles NE of Hotspot 3 (offshore from Holothuria Banks). Total flatback turtle foraging time was less here than in hotspot 3, but other turtle species have also been observed to forage in this area.
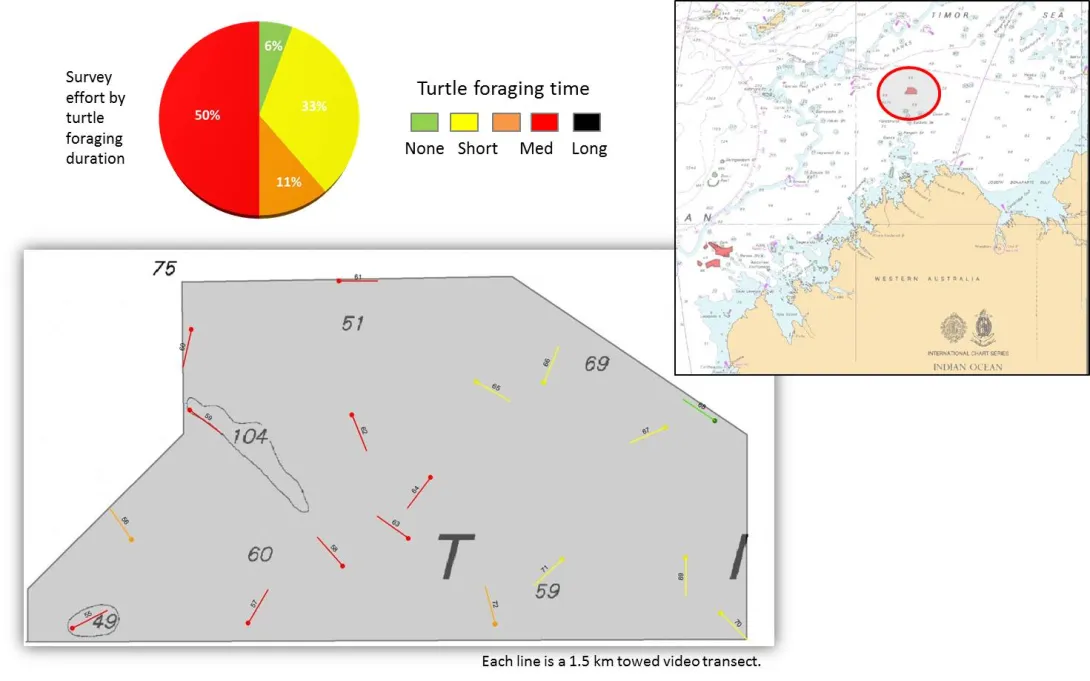
Plan for taking underwater video and sled samples offshore from Holothuria Banks.
Acknowledgements
This work would not be possible without the provision of flatback turtle tracking data from Chevron Australia, Pendoley Environmental, Parks and Wildlife, Woodside, Rio Tinto and BHP Billiton.