Aerial shoreline of the Gulf of Carpentaria
This gallery features highlights of the shoreline surveys of the Gulf of Carpentaria, including imagery of young mangroves, seagrass, dugongs, rubbish, oyster reefs, access roads, mangrove dieback, fish traps, buildings and salt flats.
This images shows an aerial view of a dugong and its calf swimming in the shallows of the mouth of the Calvert River in the Gulf of Carpentaria in 2017. The neighbouring shoreline has lots of seagrass for them to feed on.
This image comes from helicopter surveys conducted to monitor status of mangroves along the shoreline. This image collection can also be used to study other features in the littoral and intertidal regions along the coast. For more details and access to the full imagery collection see Gulf of Carpentaria Mangrove Aerial Shoreline Surveys 2017 & 2019 (NESP TWQ 4.13, JCU).
This image has a shore FID of 8050. Its location can be viewed on this interactive map.
 by Norm Duke, Jock MacKenzie, TropWATER JCU
Aerial view of fish traps at Bayley Point in the Gulf of Carpentaria. These traps are only exposed at low tide. These particular traps have an arc shape and are made from stone. Oysters have grown over the rocks cermenting the walls together, giving them a white colour. Fish are speared in these traps and crabs and oysters are harvested from the walls.
This fish trap has an identifier of AN:A01 in the Indigenout Cultral Heritage Database.
For access to the full imagery collection see Gulf of Carpentaria Mangrove Aerial Shoreline Surveys 2017 & 2019 (NESP TWQ 4.13, JCU).
This image has a shore FID of 9938 from the 2017 survey. Its location can be viewed on this interactive map.
 by Norm Duke, Jock MacKenzie, TropWATER JCU
This image shows bright blue pieces of rubbish, possibly ghost nets, along an otherwise pristine coastline. These have been washed up above the normal high water mark. Large pieces of rubbish are visible in the imagery collected to monitor status of mangroves along the shoreline. Rubbish of this size is thankfully relatively rare.
This image is near the mouth of a creek, and a sediment bank has built up in front of the beach. This bank is now being populated by mostly young mangrove trees.
For access to the full imagery collection see Gulf of Carpentaria Mangrove Aerial Shoreline Surveys 2017 & 2019 (NESP TWQ 4.13, JCU).
This image has a shore FID of 8199 from the 2017 survey. Its location can be viewed on this interactive map.
 by Norm Duke, Jock MacKenzie, TropWATER JCU
This image shows dense seagrass at low tide with lots of trails through it. These are possibly feeding trails.
Seagrass is found in many locations along the Gulf of Carpentaria shoreline.
This image comes from helicopter surveys conducted to monitor status of mangroves along the shoreline. This image collection can also be used to study other features in the littoral and intertidal regions along the coast. For more details and access to the full imagery collection see Gulf of Carpentaria Mangrove Aerial Shoreline Surveys 2017 & 2019 (NESP TWQ 4.13, JCU)
This image has a shore FID of 7612. Its location can be viewed on this interactive map.
 by Norm Duke, Jock MacKenzie, TropWATER JCU
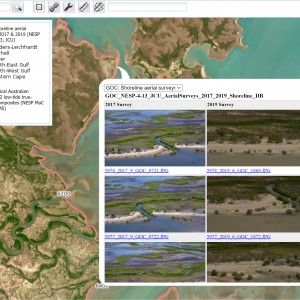
You can view the shoreline imagery of the Gulf of Carpentaria via an interactive map. Each location, shown as dots on the map, corresponds to an image of the shore. Clicking on the map shows the imagery at that location. Clicking on the thumbnails in the popup shows the images full screen. The popup shows the images for all the locations within several pixels around where you click on the map. This means if you are zoomed out, you will see multiple images along the shore, but when zoomed in, you will only see images from individual locations. This view allows you to quickly preview specific locations but is not ideal for browsing a large sequence of images for analysing a section of the coastline. For that, you are better off using the gallery view.
 by Eric Lawrey (eAtlas)
This image shows an example of the mass dieback of mangroves that occurred in the Gulf of Carpentaria. Mangroves in the upper fringe died due to lack of water. A combination of extreme climatic conditions associated with an unusually severe El Niño event led to temporary drop in sea level of 40 cm for six months, high temperatures and drought conditions. These factors resulted in the mangrove ecosystems receiving little or no water, causing them to dry out and die.
This image comes from helicopter surveys conducted to monitor status of mangroves along the shoreline. This image collection can also be used to study other features in the littoral and intertidal regions along the coast. For more details and access to the full imagery collection see Gulf of Carpentaria Mangrove Aerial Shoreline Surveys 2017 & 2019 (NESP TWQ 4.13, JCU)
This image has a shore FID of 7408 and was taken in the 2017 survey. Its location can be viewed on this interactive map.
 by Norm Duke, Jock Mackenzie (JCU - TropWATER)
This photo shows a shallow sandy/muddy foreshore with small oyster reefs in the foreground, a young mangrove forest in the middle and salt flats in the background. These oyster reefs are composed of oyster shells that have grown and adhered together over time, forming small, irregular structures. These oyster reefs are visible only during low tide, as they are otherwise submerged.
Oyster reefs can be found sporadically along the coastline of the Gulf of Carpentaria. This location is 6 km south of Bayley Point.
The distribution of oyster reefs along the northern Australian coastline is not well known. The NESP MaC Project 4.13 - Mapping and characterising Australia’s tropical shellfish reefs 2024 - 2026 (GU) hopes to identify more of these reefs.
For access to the full imagery collection see Gulf of Carpentaria Mangrove Aerial Shoreline Surveys 2017 & 2019 (NESP TWQ 4.13, JCU).
This image has a shore FID of 10004 from the 2017 survey. Its location can be viewed on this interactive map.
 by Norm Duke, Jock MacKenzie, TropWATER JCU
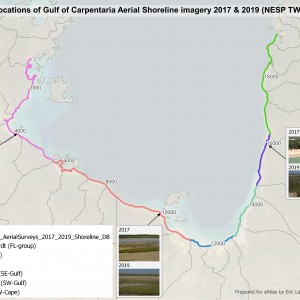
This map shows the extent of the shoreline aerial imagery. The numbers on the map indicate the Shore FID of each location along the transect and the different colours represent the grouping of the imagery into different regions. The interactive map allows users to view each location, shown as dots on the map corresponding to an image of the shore.
 by Eric Lawrey (eAtlas)
This video shows a full walk through of all the items discussed in this article, with additional details. It covers using the imagery via the map view, how to read Shore FIDs, how to view the imagery with the gallery, and how to use the original dataset spreadsheet to get the exact locations of each Shore FID. It also shows an example of how to use these tools together to create a dataset of features shown in the imagery.
You can watch the video tutorial here.
 by Eric Lawrey (eAtlas)
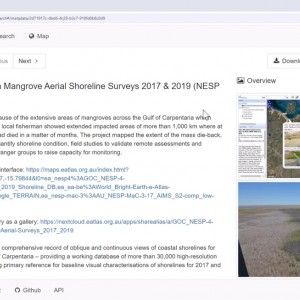
This animation shows how to view the NESP TWQ 4.13 shoreline imagery as a photo gallery that allows you to rapidly step through the imagery along the coastline. It starts with the data download page in NextCloud for the dataset. The 2017 shoreline imagery is in the ‘images/2017_Shoreline’ folder and is organised by regions around the Gulf of Carpentaria. The location of these regions is shown in the interactive map of the dataset.
When viewing one of the folders of photos switching to gallery view to see them as a grid of thumbnail images can allow a quick scan of the coastline, whilst still seeing some details. Clicking on an individual photo shows it close to full screen with the option to step to the next and previous images. This is the best way to rapidly view the coastline in detail.
 by Eric Lawrey (eAtlas)
This image showcases young mangroves growing at the mouth of the Robinson River in the Gulf of Carpentaria. The river's sediment plays a crucial role in shaping this landscape. As the river flows towards the bay, it carries with it a significant amount of sediment. This sediment is deposited at the river's mouth, forming banks and expanding into the bay. These sediment banks create an ideal environment for mangroves to thrive.
Mangroves are highly effective at trapping and stabilizing sediment with their intricate root systems. The roots slow down the water flow, causing suspended particles to settle. Over time, this process builds up the sediment, gradually expanding the landmass at the river's mouth. The young mangroves visible in the image are in various stages of growth, indicating a dynamic and continually evolving landscape.
This natural sediment-trapping mechanism is essential for coastal ecosystems as it provides a buffer against erosion, enhances water quality by filtering pollutants, and creates habitats for a wide range of marine and terrestrial species. The expansion of mangroves also contributes to carbon sequestration, making them vital for climate change mitigation efforts.
This image comes from helicopter surveys conducted to monitor status of mangroves along the shoreline. This image collection can also be used to study other features in the littoral and intertidal regions along the coast. For more details and access to the full imagery collection see Gulf of Carpentaria Mangrove Aerial Shoreline Surveys 2017 & 2019 (NESP TWQ 4.13, JCU)
This image has a shore FID of 7408 and was taken in the 2017 survey. Its location can be viewed on this interactive map.
 by Norm Duke, Jock MacKenzie, TropWATER JCU


