
Media for project "Marine Monitoring Program – Assessment of transport, extent and exposure of terrestrial run-off in the Great Barrier Reef using water quality monitoring, modelling and remote sensing (TropWATER, JCU and Howley Environmental Consulting)"
This page is archived and only represents the MMP up to 2020. The new main web page for all of the MMP is managed by GBRMPA.
Description
Support for the aerial footage was provided by TropWATER JCU, the Marine Monitoring Program - Inshore Water Quality through the Great Barrier Reef Marine Park Authority, the Queensland Government, the Landholders Driving Change project led by NQ Dry Tropi
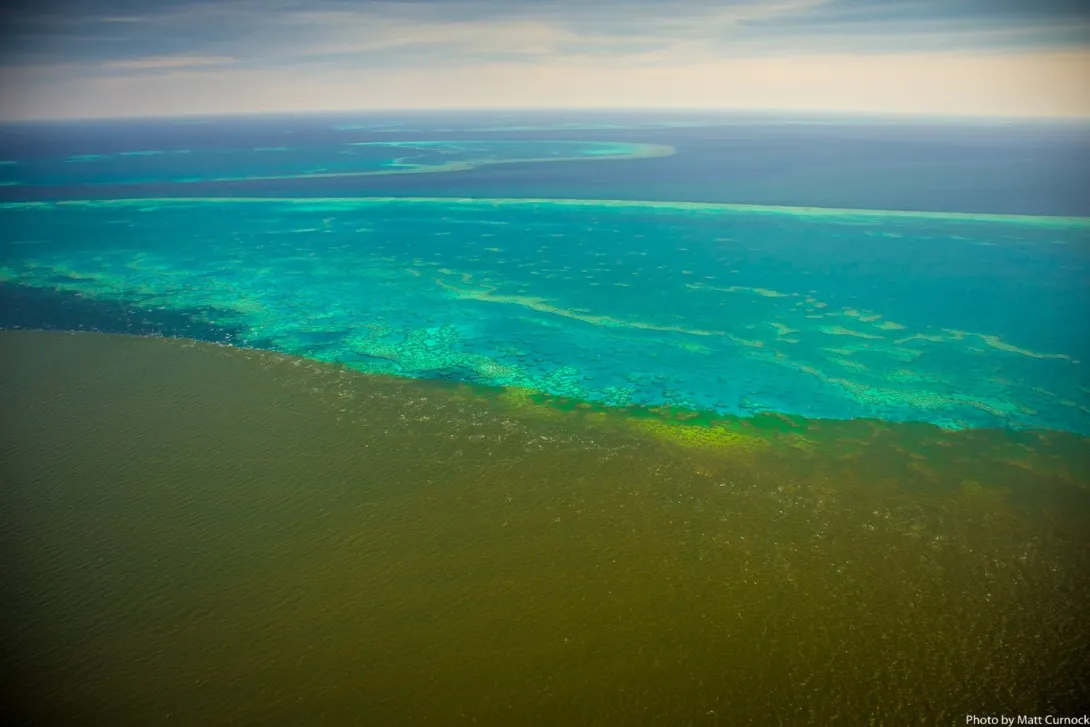
This project monitors trends in marine water composition during flood periods and the austral wet season (figure above), and assesses transport of major land-sourced pollutants to the Great Barrier Reef (GBR) lagoon as well as the exposure of GBR coral reef and seagrass ecosystems. This information is estimated from the synthesis of river discharge, measured and modelled pollutant loads, water quality data sampled at inshore sites during wet season conditions and the use of remote sensing technology to estimate marine water composition and flood plume extent and frequency.
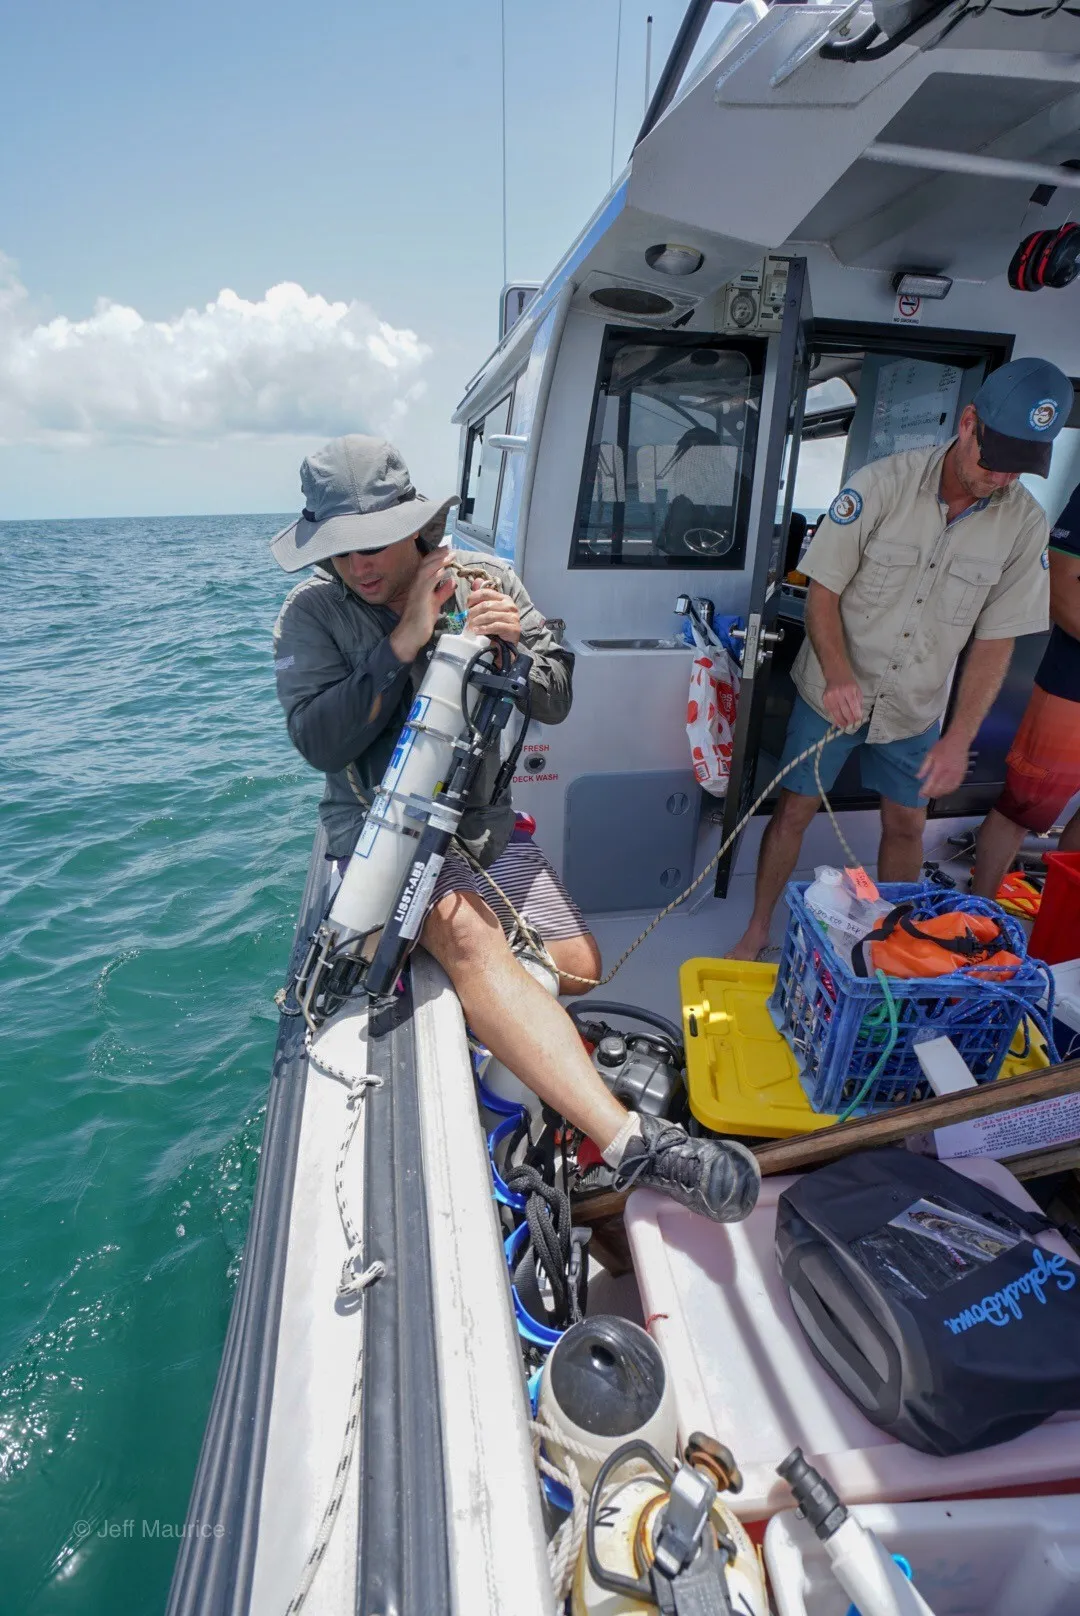
Flood plume sampling is carried out during the north Queensland wet season (Dec – May) and focused on sampling the plumes from established monitoring locations from the Cape York region, Tully, Russell-Mulgrave, Burdekin, Proserpine-O’Connell and Pioneer Rivers (figure below). Plume water quality is measured through a combination of in situ water quality measurements taken at peak and post flow conditions and remote sensing analysis. Sample collection is typically focused on near-shore sites and river mouths and includes analysis of temperature, salinity, total suspended sediment, chlorophyll-a, nutrients (carbon, nitrogen and phosphorus species and silica), coloured dissolved organic matter (CDOM) and pesticides.
Description
Sampling flood plumes in the Great Barrier Reef
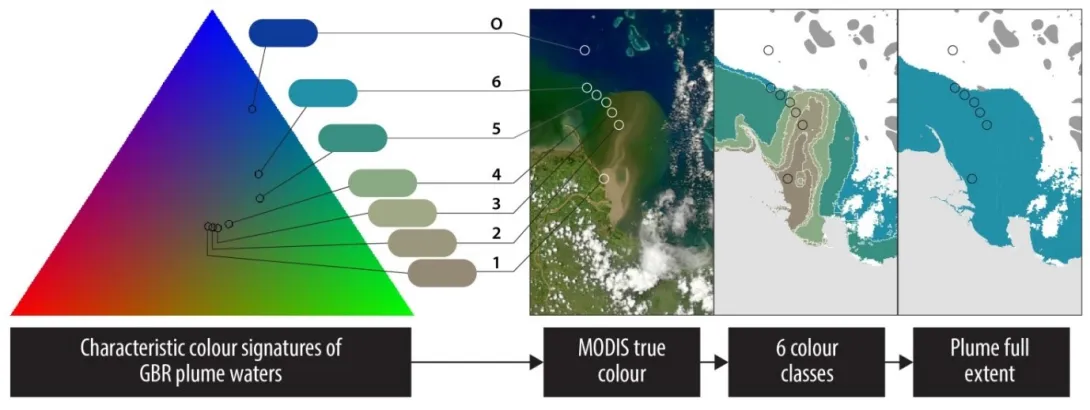
A remote sensing method has been developed which involves the classification of Moderate-Resolution Imaging Spectroradiometer (MODIS) true colour data into six distinct water bodies using a colour scale specifically developed for the GBR [1]. Using this information, several monitoring and reporting products are derived and are operationally implemented into the GBR Marine Park Marine Monitoring program (MMP). The MMP supports the assessment of water quality progress under the Australian and Queensland Government's Reef 2050 Water Quality Improvement and Reef 2050 Long Term Sustainability Plan.
The colour of the ocean
The colour of the ocean is one of the first apparent features to the human eye when observing the ocean, and has been recently identified, along with ‘Clear Water’ as two of the twelve most important indicators of aesthetics in the Great Barrier Reef for the purposes of management [2]. It is related to the absorption and scattering effects of optically active water quality components present in the water, which also influence the underwater light available for photosynthetic organisms. Phytoplankton generally cause a green colouration to the water due to the presence of chlorophyll within its cells. The NAP commonly results in a brownish to reddish colouration dependent on the origin of the material, and the CDOM causes a yellow to brownish colouration. Water colour can be measured by satellite sensors without requiring field knowledge of bio-optical properties and is a simple indicator available to study the composition of our ocean and to distinguish different surface water bodies and their associated water quality characteristics [3, 4].
The wet season colour scale
Six water bodies, corresponding to six distinct colour classes present during the wet season, have been identified and are mapped over the GBR using a colour classification scale developed by The Centre for Tropical Water and Aquatic Ecosystem Research (Tropwater), James Cook University (JCU) (figure below).
Description
Triangular colour plot showing the characteristic colour signatures of the GBR wet season waters in the Red-Green-Blue (or true colour) space. A remote sensing method has been developed to map these characteristic coastal water types in the GBR using a su
In this wet season colour scale:
- The brownish to brownish-green turbid water bodies (colour classes 1 to 4, or Primary water type) are typical for inshore regions influenced by GBR river plumes or nearshore marine areas with elevated concentrations of suspended sediments found during the wet season. This water type is typically present during high river discharge events and contains elevated concentrations of nutrient and phytoplankton, but is also enriched in sediment and CDOM resulting in reduced light levels.
- The greenish to bluish-green turbid water bodies (colour class 5, or Secondary water type) is typical of coastal waters rich in algae and also contains dissolved organic matter and fine sediment. This water type is found in the GBR open coastal waters as well as in the mid-water river discharge plumes where relatively high nutrient availability and increased light levels due to sedimentation favour coastal productivity.
- The greenish-blue water mass (colour class 6 or Tertiary water type) corresponds to waters with slightly-above ambient water quality concentrations. This water type is typical for areas towards the open sea or the outer extent of river flood plumes.
The wet season colour scale has been coupled with field measurements collected through the Marine Monitoring Program - Inshore water quality monitoring (AIMS and JCU) and related to optically active water quality components such as Total Suspended Solids (TSS), Chl-a and CDOM present in surface waters during the wet season, and Secchi Disk Depth (SDD) (table below).
Table 1: Mean multi-annual TSS, Chl-a CDOM and SDD (and Standard error, SE) measured in-situ in the Primary (colour classes 1-4), Secondary (colour class 5) and Tertiary (colour class 6) water types of the GBR, assessed between wet seasons 2002 to 2018 [5].
| Water types | TSS (mg. L-1) | Chl-a µg. L-1 | CDOM (m-1) | SDD (m) |
| Primary | 16.4 (SE 33.3) | 1.6 (SE 2.6) | 0.8 (SE 0.9) | 1.6 (SE 1.4) |
| Secondary | 6.3 (SE 8.1) | 0.8 (SE 0.8) | 0.3 (SE 0.4) | 3.9 (SE 2.2) |
| Tertiary | 4.2 (SE 5.2) | 0.5 (SE 0.5) | 0.1 (SE 0.2) | 7.2 (SE 3.8) |
Monitoring products
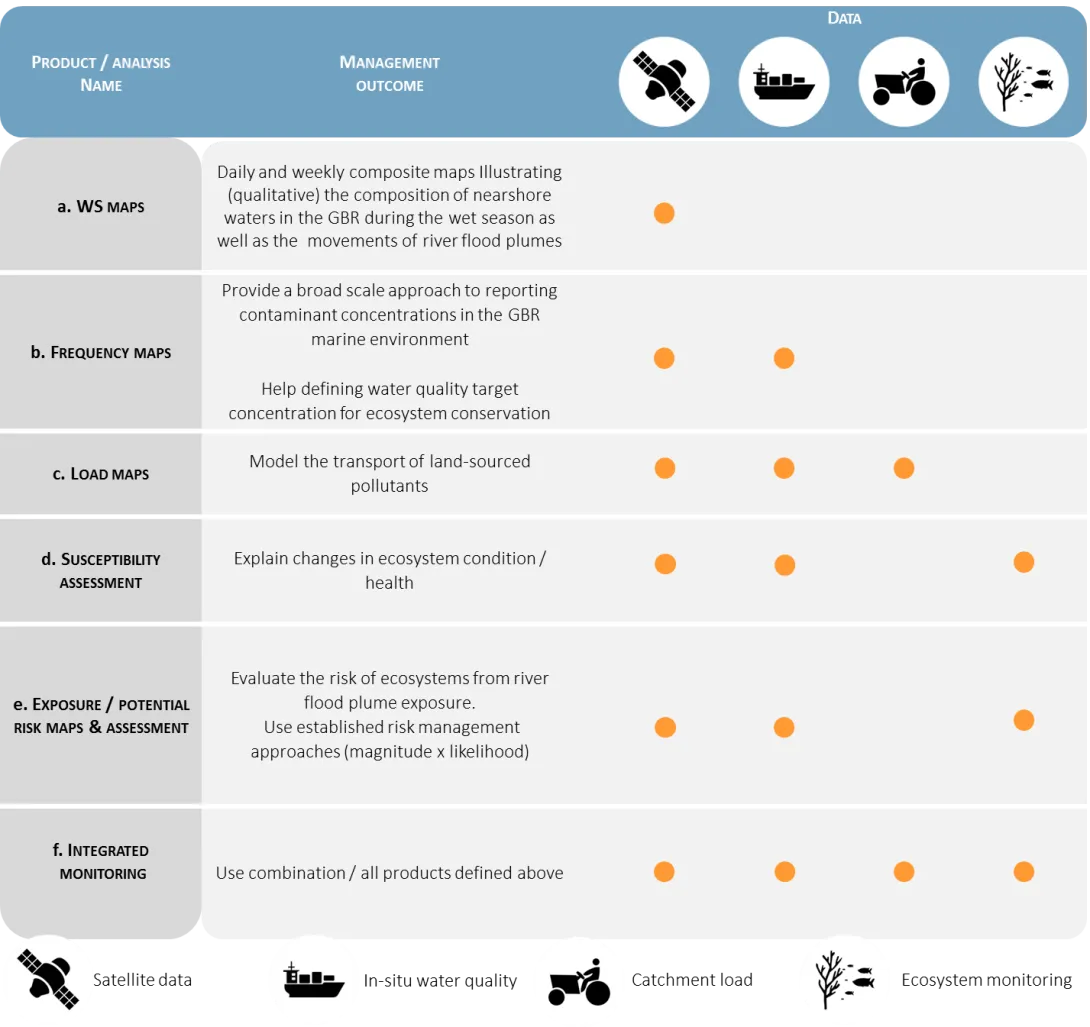
Several operational monitoring products are derived using MODIS satellite imagery classified with the wet season colour scale (figure below). Examples of monitoring products used in the MMP are given in figures below.
- Daily colour class maps, weekly composite maps and frequency maps are used to illustrate the wet season conditions for every year, and to compare seasonal trends with long-term trends in water composition. The weekly products can also be used to assess the extent of river flood plumes in the GBR.
- Frequency maps are compared with ecological health information collected through the coral reef and seagrass components of the MMP [6, 7] to better understand the susceptibility of the seagrass meadow and coral reef ecosystems to water quality conditions.
- Surface loading maps that model the transport of land-sourced pollutants (TSS and dissolved inorganic nitrogen) created by linking frequency maps with water quality field measurements and modelled catchment loads.
- Information on the seasonal and long-term pollutant concentrations measured in the WS colour classes are compared to published ecological thresholds and, combined with frequency maps, are used in a magnitude x likelihood risk management framework to develop surface exposure maps (also referred to as potential risk maps in some GBR studies).
- Finally, assessments of ecosystem exposure are made through the calculation of the areas and percentages of coral reefs and seagrass meadows affected by different categories of exposure.
These monitoring products have been produced and analysed for the last 17 years (2002-2018 and figure below); however monitoring in Cape York has only commenced in 2017.
Description
Example of operational monitoring products and assessment methods used to monitor the inshore water quality of the Great Barrier Reef through the Marine Monitoring Program (MMP).
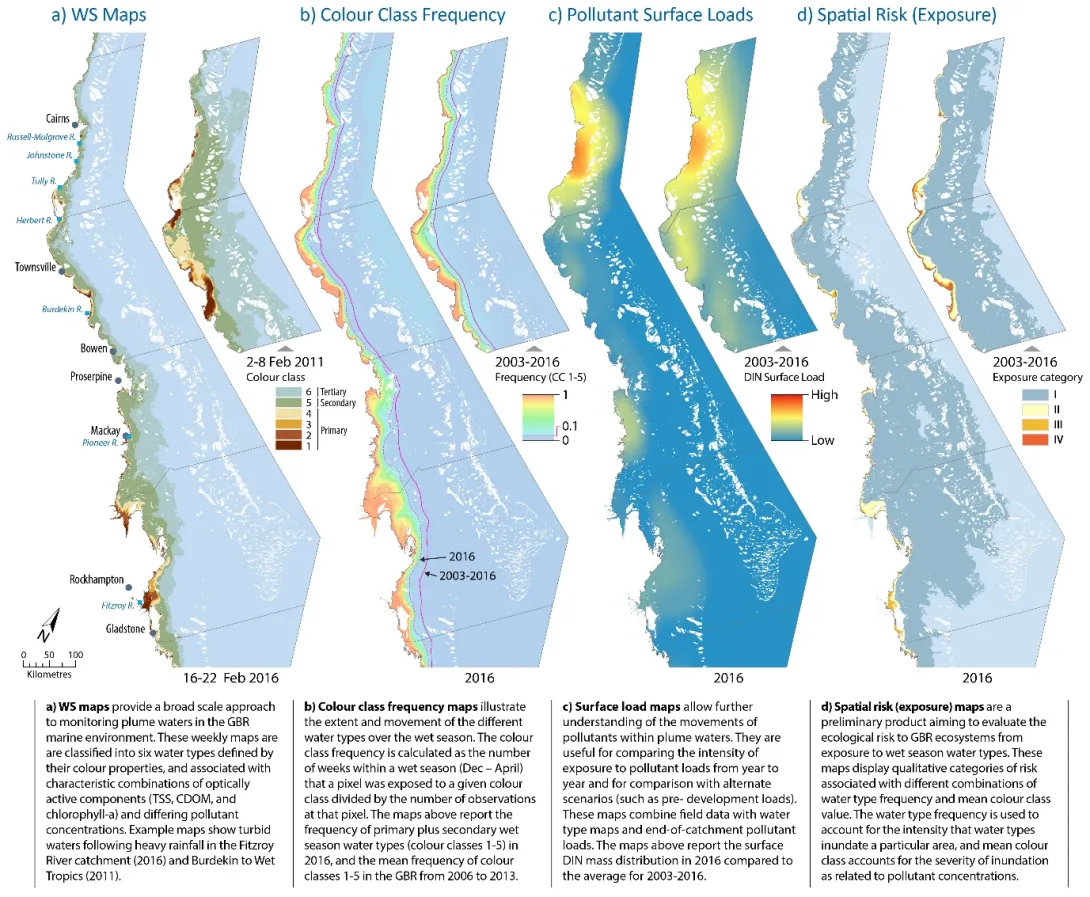
Description
Summary description of the wet season water quality products derived from remote sensing information in the MMP illustrated using outputs from the 2016 wet season.
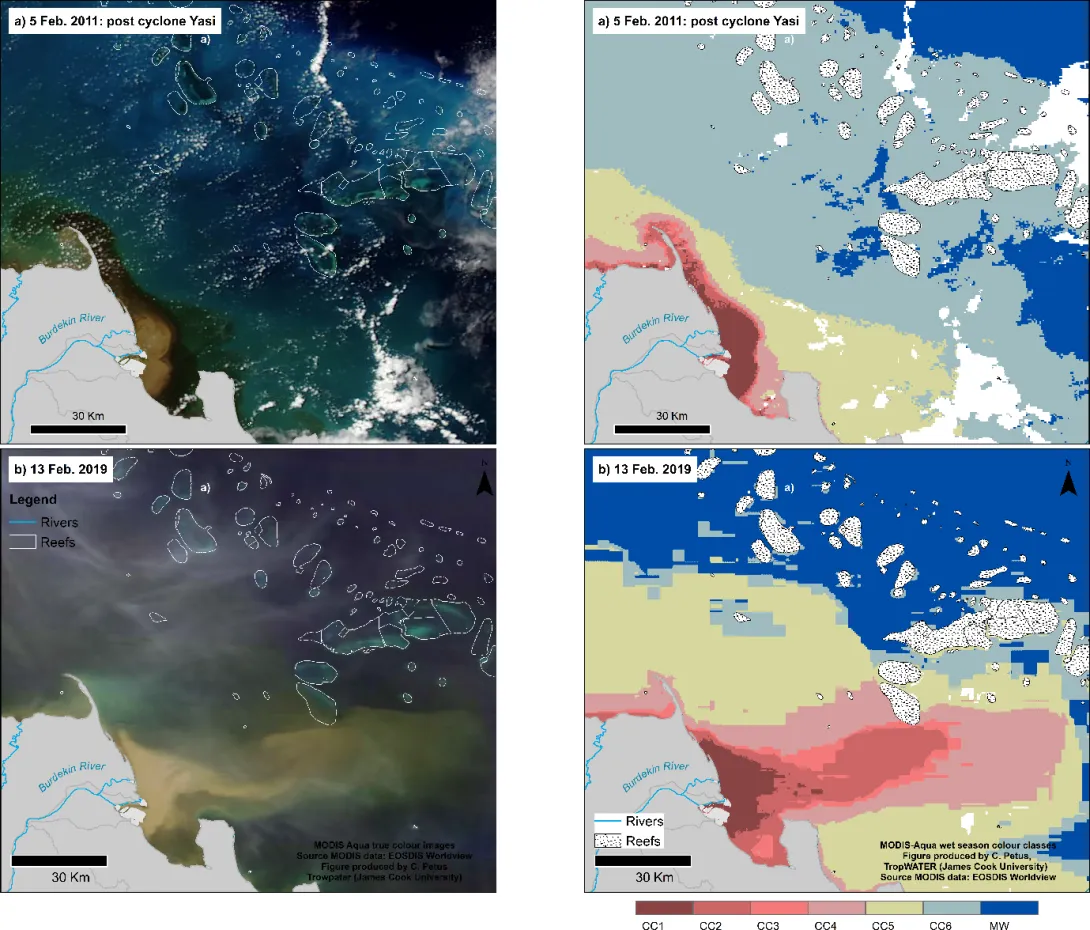
Description
True colour satellite images from NASA MODIS satellite highlighting the extent of the Burdekin River plume in the GBR during the 2019 big flood compared to the last big flood event of 2011 (L), and wet season water type maps (R) (Source: EOSDIS Worldview)
References
- [1] Alvarez-Romero, J., Devlin, M., da Silva, E., Petus, C., Ban, N., Pressey, R., Kool, J., Roberts, J., Cerdeira-Estrada, S., Wenger, A., Brodie, J., 2013. A novel approach to model exposure of coastal-marine ecosystems to riverine flood plumes based on remote sensing techniques. J. Environ. Manag. 119. 194-207
- [2] Marshall, N., Marshall, P., Curnock, M., Pert, P., Smith, A., & Visperas, B. (2019). Identifying indicators of aesthetics in the Great Barrier Reef for the purposes of management. PloS one, 14(2), e0210196.
- [3] Devlin, M., Petus, C., Teixeira da Silva, E., Tracey. D., Wolff, N., Waterhouse, J., Brodie, J., 2015. Water Quality and River Plume monitoring in the Great Barrier Reef: An Overview of Methods Based on Ocean Colour Satellite Data. Remote Sens. 7, 12909-12941; doi:10.3390/rs71012909
- [4] Petus, c., Waterhouse, J., Lewis, S., Vacher, M., Tracey, D., Devlin, M., In Press. A flood of information: using Sentinel-3 water colour products to assure continuity in the monitoring of water quality trends in the Great Barrier Reef (Australia). Journal of Environemntal management
- [5] Gruber, R., Waterhouse, J., Logan, M., Petus, C., Howley, C., Lewis, S., Tracey, D., Langlois, L., Tonin, H., Skuza, M., Costello, P., Davidson, J., Gunn, K., Wright, M., Zagorskis, I., Kroon, F., Neilen, A., in Press. Marine Monitoring Program: Annual Report for inshore water quality monitoring 2017-18. Report for the Great Barrier Reef Marine Park Authority, Great Barrier Reef Marine Park Authority, Townsville.
- [6] McKenzie, L.J., Collier, C.J, Langlois, L.A., Yoshida, R.L., Smith, N. and Waycott, M. 2018, Marine Monitoring Program: Annual Report for inshore seagrass monitoring 2016-2017. Report for the Great Barrier Reef Marine Park Authority, Great Barrier Reef Marine Park Authority, Townsville, 248pp.
- [7] Thompson, A., Costello, P., Davidson, J., Logan, M., Coleman, G., Gunn, K. 2018, Marine Monitoring Program. Annual Report for inshore coral reef monitoring: 2016 – 2017, Great Barrier Reef Marine Park Authority, Townsville.148 pp.
- [8] Waterhouse J, Lønborg C, Logan M, Petus C, Tracey D, Lewis S, Tonin H, Skuza M, da Silva E, Carreira C, Costello P, Davidson J, Gunn K, Wright M, Zagorskis I, Brinkman R, Schaffelke B, 2017. Marine Monitoring Program: Annual Report for inshore water quality monitoring 2015-2016. Report for the Great Barrier Reef Marine Park Authority, Great Barrier Reef Marine Park Authority, Townsville, 227pp.
- [9] Waterhouse, J., Lønborg, C., Logan, M., Petus, C., Tracey, D., Lewis, S., Howley, C., Harper, E., Tonin, H., Skuza, M., Doyle, J., Costello, P., Davidson, J., Gunn, K., Wright, M., Zagorskis, I., Kroon, F. and Gruber, R., 2018, Marine Monitoring Program: Annual Report for inshore water quality monitoring 2016-2017. Report for the Great Barrier Reef Marine Park Authority, Great Barrier Reef Marine Park Authority, Townsville.