Map Gallery
Published on
Image
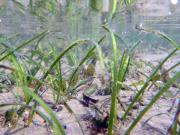
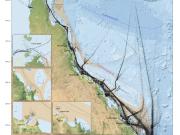
This map shows the extent of the seagrass meadows on the Great Barrier Reef based on two datasets. It shows the inshore seagrass distribution and the deep water seagrass mapping by the Seabed Biodiverity project.
Published on
Image
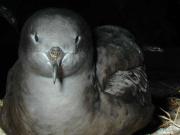
This map shows the foraging paths of two nesting shearwater birds that were tracked off Heron Island. The tracks show their foraging trips to collect food for their young.
Published on
Image
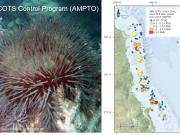
This map shows the number of large (> 40 cm) Crown of Thorns Starfish (COTS) removed by the AMPTO run control program (culling of COTS) during their first visit to each of the control sites. This map shows the first visit to each site as this is the visit when typically the most COTS are detected. In subsequent visits the number of COTS is typically reduced as a result of the culls from previous visits.
Published on
Image
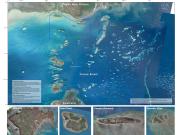
This poster map shows satellite and aerial imagery of Torres Strait. It also shows the Australia Maritime Boundariers in the region. This region neighbours with Papau New Guinea resulting in complex maritime boundaries.
Published on
Image
This map shows the density of shipping traffic as measured by the Automatic Identification System (AIS). Each black dot on the map represents a reading of a vessel location taken each hour over a 3 month period in 2013. AIS is fitted to all large ships (cargo ships, container ships, bulk carriers, tankers, etc) and ferries (more than 12 passengers) and is optional for smaller recreational vessels.
Published on
Image
This animation shows the locations of Crown of Thorns Starfish (COTS) outbreaks as measured over the last 30 years.
Published on
Image
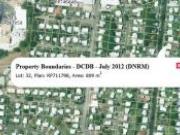
You can now view the lot number, plan number and property area for any property in Queensland. Simply zoom and pan the map to the area of interest and click to get the information.