Recent datasets

Vegetation mapping of the Wet Tropics Bioregion 2008 (WTMA)

Published on
01 December 2013

This dataset contains polygons depicting vegetation communities of the Wet Tropics Bioregion. Over 250 vegetation types are described using structural and floristic characteristics, and the vegetation communities have been classified using a logical, hierarchical framework. At a broad level, the vegetation includes the rainforests, forests and woodlands, sclerophyll rainforests, shrublands and heathlands, herblands and mangrove communities distributed throughout the bioregion. The dataset is derived from 1:25 000 stereo aerial photography. J.P. Stanton and D.J.

Geology of the Wet Tropics Bioregion (WTMA)

Published on
01 December 2013

This dataset contains polygons depicting geology as deliniated by botanist J.P.Stanton and geologist D.J.Stanton within the Wet Tropics bioregion. The geology mapping of the Wet Tropics Bioregion is based on interpretation of aerial photographs during WTMAs Vegetation of the Wet Tropics of Queensland bioregion mapping project. Aerial photography was also used to select sites and traverses for ground truthing work. The geological classification and boundaries were based on their relevence to vegetation patterns. The dataset has been derived from 1:25,000 aerial photography.

Wet Tropics Bioregion - Contours (WTMA)

Published on
01 December 2013

This dataset contains line and point features depicting contours across the Wet Tropics Bioregion as shown on the 1:50,000 scale National Topographic Maps. The dataset derives from Geoscience Australias 1:50,000 scale National Topographic Map Series data. Accuracy: Horizontal accuracy is at 90% of well-defined detail within +/- 25m of true position. Data reproduced with permission of Wet Tropics Management Authority. This metadata was prepared for the eAtlas and is not authoritative. Please contact the Wet Tropics Management Authority for an authoritative record.

Point of contact

Spot heights for the Wet Tropics Bioregion (WTMA)

Published on
01 December 2013

This dataset contains point features depicting spot heights for the Wet Tropics Bioregion. The SpotHeight-250K dataset was sourced primarily from the 1:250 000 scale National Topographic Map Series (NTMS) and the Royal Australian Survey Corps Joint Operation Graphics (JOG) map reproduction material (repromat). This dataset consists of a 25 MB shapefile containing 134,007 point features. Accuracy Horizontal accuracy is at 90% of well-defined detail within +/- 125m of true position. The dataset has an attribute accuracy of 100%.

Wet Tropics of Queensland World Heritage Area - boundary (WTMA)

Published on
01 December 2013

This dataset contains polygon features that represent the zoning classification of lands within the Wet Tropics World Heritage Area, according to the Wet Tropics Management Plan 1998. This dataset is a working depiction only. For legal confirmation, refer to signed maps held at WTMA. http://www.wettropics.gov.au...dary-maps The World Heritage Area boundary is legally defined by Wet Tropics Management Authority (WTMA) WTQ1 SH1-32 series. (Note: Along the coastline, it shall be low water mark).

NERP TE Project Maps - Areas of research activity, tracks and sites (NERP TE 13.1, AIMS)

Published on
26 November 2013

This dataset describes the areas of research activities for the 38 National Environmental Research Program Tropical Ecosystem (NERP TE) Hub projects. It represents the areas that have field work being conducted, where measurements have been taken and where modelling or analysis is being done. It consists of three master shapefiles (points, lines and polygons) that capture the regions that are being studied by all these projects. These master shapefiles are also made available split by project.

Queensland Ship Vessel Tracking (AIS) May - Aug 2013 (NERP TE 13.1 eAtlas, source: AMSA)

Published on
06 September 2013

This dataset consists of 107 days of vessel tracking using the Automatic Identification System (AIS) at 1 hour intervals extracted for the Queensland region from the Spatial@AMSA Historic Vessel Tracking website (AMSA 2013). It has been converted to Shapefile format and contains just under 1 million points. Note: The Spatial@AMSA Historic Vessel Tracking website is no longer available, however similar and more recent data is now available from Spatial@AMSA Vessel Tracking Data website (https://www.operations.amsa....gitalData).

Australian Openstreetmap Major Roads December 2011 (NERP TE 13.1 eAtlas, source:Cloudmade)

Published on
14 August 2013

This dataset contains the major roads for Australia, extracted from the OpenStreetMap project on December 2011 by CloudMade. From the complete set of roads in the OpenStreetMap shapefile only major roads were extracted. This created a smaller high performance shapefile. In ArcMap loaded the AU_CloudMade_OpenStreetMap-Dec-2011 shapefile then used the Analysis Tools/Extract/Select tool to extract the major roads.

Global hillshading from SRTM30_PLUS v8.0 (NERP TE 13.1 eAtlas, source: UCSD)

Published on
31 July 2013

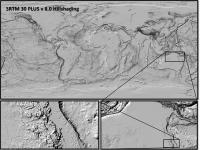
This dataset consists reprocessing and reformatting the SRTM30 PLUS v8.0 Digital Elevation Model (DEM) dataset developed by Scripps Institute Of Oceanography, University of California San Diego (UCSD) to produce a single raster covering the globe in GeoTiff format and create a full and low resolution hillshading from this DEM. The aim of this derived dataset is to reformat the data to allow easy use with GIS applications. Full resolution hillshading: The hillshading was produced by combining the 33 source DEMs using gdal_translate then processing using gdaldem with a z-factor of 0.0001.

Bright Earth eAtlas Basemap (NERP TE 13.1 eAtlas, AIMS)

Published on
31 July 2013

The Bright Earth eAtlas Basemap dataset collection is a satellite-derived global map of the world at a 1:1M scale for most of the world and 1:200k scale for Australia. This map was inspired by Natural Earth II (NEII) and NASA's Blue Marble Next Generation (BMNG) imagery. Its aim was to provide a basemap similar to NEII but with a higher resolution (~10x).

Bright Blue Marble Next Gen Imagery 2004 (NERP TE 13.1 eAtlas, source: NASA)

Published on
31 July 2013
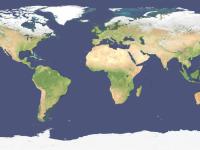
This layer shows a 500m resolution image of the world derived from the Blue Marble Next Generation April 2004 image (86400x43200 pixels). As the image was derived from MODIS satellite imagery during Autumn in the Northern Hemisphere the high latitude countries (Russia, Canada, etc) are covered in snow. The colour and tonal range of the original Blue Marble image was compressed and brightened to make the image suitable for use as a basemap.
Great Barrier Reef Marine Park Boundary - Ocean Bounds (NERP TE 13.1 eAtlas, source:GBRMPA)

Published on
26 April 2013

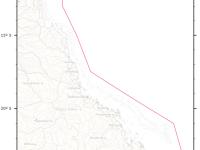
This dataset shows the ocean side boundary of the Great Barrier Reef Marine Park, excluding the inner boundary along the Queensland coastline. This dataset was derived from the Great Barrier Reef Marine Park Boundary dataset by loading the GBRMPA_BOUNDS_Line.shp (supplied by GBRMPA) into ArcMap then deleting the verticies along the coastline, breaking the original closed line loop. This dataset is not authorive and was produced for use in the eAtlas. Contact the Spatial Data Centre at GBRMPA for the official boundaries.

Originator

Population genetics and microbial analysis of the Dictyoceratida sponge, Coscinoderma matthewsi, from central and eastern Torres Strait, Australia (MTSRF Project 1.3.2)

Published on
28 February 2013

During the central and eastern Torres Strait survey in November 2006, tissue samples of 10 individuals of the sponge Coscinoderma matthewsi were collected from 5 island groups: Ugar (Stephen Island) and Erub (Darnley Island) in eastern Torres Strait; and the Masig group (Kodall Island and Keats Island), Poruma (Coconut Island) and Warraber (Sue Island) in central Torres Strait. These island groups are on average, 66 km apart. All sponge samples were placed in separate cryo-tubes and preserved in liquid nitrogen until they could be stored at -80°C.

Influence of size and spatial competition on the bioactivity of coral reef sponges from Torres Strait (MTSRF Project)

Published on
25 February 2013

Size frequency surveys of the sponges Coscinoderma matthewsi, Hyrtios erecta and Ianthella basta (yellow color morph) were conducted at Masig Island, central Torres Strait, in March 2007. At each of eight sites, separated by at least 200 m, three randomly positioned 30 x 1 m transects were surveyed, with each transect separated by at least 20 m. All transects were located on sloping reef at between 10 and 12 m depth.The greatest dimension of each sponge was measured for Coscinoderma matthewsi and Ianthella basta, and used as an approximation of overall sponge size.

eAtlas World Baselayer Version 1 (NERP TE 13.1, AIMS)

Published on
25 February 2013

The eAtlas baselayer is a collection of datasets from third parties styled and combined together to produce a world wide map layer with reasonable detail across the Great Barrier Reef suitable as a baselayer in web mapping applications. The primary basis for this baselayer is the Natural Earth 2 public domain raster map of the world. Overlaid on this is country outlines, cities and Great Barrier Reefs. It has a focus on Australia and the Great Barrier Reef and includes a high resolution coast for Australia (100k) and an even high resolution coast for Queensland (50k).

Assessing the effects of changes in Great Barrier Reef Marine Park Zoning plans on southern mid-shelf shoals (MTSRF Project 4.8.2)

Published on
17 October 2012

Surveys were undertaken in February/March 2007 (Autumn), August/September 2007 (Spring) and October 2009 (Spring) on two pairs of discrete deepwater shoals in the mid-shelf section of the southern Great Barrier Reef. The objective was to find pairs of shoals that were matched in terms of depth, habitat, areal extent, cross shelf position and latitude. Within each pair, one shoal was to be from a 'green zone' (closed to all fishing) and the other from a 'blue zone' (open to fishing), based on the rezoning of the Great Barrier Reef Marine Park, carried out in 2004.

Queensland Landuse Current

Published on
13 September 2012

This dataset is a complete state-wide digital land use map of Queensland. The dataset is a product of the Queensland Land Use Mapping Program (QLUMP) and was produced by the Queensland Government. It presents the most current mapping of land use features for Queensland, including the land use mapping products from 1999, 2006 and 2009, in a single feature layer. This dataset was last updated July 2012. The dataset comprises an ESRI vector geodatabase at a nominal scale of 1:50,000 in coastal regions and 1:100 000 in Western Queensland.

NERP TE Project 12.3 - Relative social and economic values of residents and tourists in the WTWHA, 2012-2014 (JCU)

Published on
22 July 2012

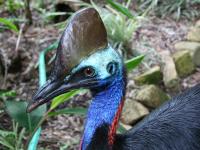
The Wet Tropics World Heritage Area (WTWHA) is famous for its wildlife, biodiversity and natural beauty, but none of these important assets are bought or sold in the market place, so none are explicitly ‘valued’ with a price. Recognising that absence of price does not mean absence of value, this project seeks to improve our understanding of the importance of these non-market ‘values’ to a variety of different stakeholders. How important is a beautiful view or a cassowary to the community, to tourists and to the tourism industry?

NERP TE Project 4.1 - Tracking coastal turbidity over time and demonstrating the effects of river discharge events on regional turbidity in the GBR, 2012-2014 (AIMS)

Published on
22 July 2012

Turbidity is a measure of water clarity that quantifies the amount of small particles suspended in the water, and is a fundamental environmental parameter influencing coastal marine ecosystems. Turbidity reduces the light needed for photosynthesis by corals and seagrasses, and suspended particles also transport nutrients, pollutants and diseases. Previous research based on 3 years of turbidity data collected from 15 inshore reefs by the Reef Rescue Marine Monitoring Program has shown that it can take several months for water clarity to improve after river floods.