Temperature Loggers Climatology For The GBR Region (NESP TWQ 4.2, AIMS)
Published on
14 March 2019
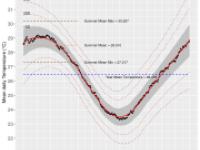
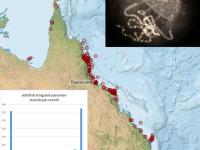
The climatology of the GBR temperature loggers is based on the hourly registers from loggers with 10 or more years of data, up to 2012 and for "Slope" and "Flat" locations on the reef. The climatology is important as a reference point for comparison of future values. It also allows to compute the anomalies which represent the deviations from an established baseline. The data comes from the AIMS temperature loggers program and contains temperature registers as old as from 1991, providing for some sites, a time series of water temperature for more that 28 years.