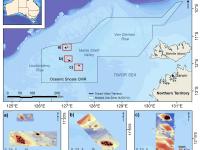
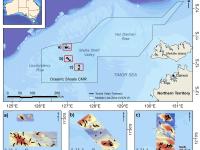
Towed Video deployments in Timor Sea Banks and Shoals (Montara 4)
Published on
11 September 2017
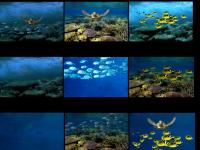
Towed Video surveys down to a depth of ~50 m was completed successfully at the following shoals (Baracuda East, Goeree Shoal, Vulcan Shoal). Sampling involved habitat classification conducted in real-time during the surveys, and taking photographic still image at 5s intervals for subsequent analysis as the cameras were towed across the shoals at a speed of 1-2 knots. This project is a co-investment between PTTEPAA and AIMS, in order to build scientific knowledge on a number of shoal features in the area near Montara and was undertaken between 19/9/2016 - 24/9/2016.