Key Source Reefs for Community Recovery following 2016-2017 Mass Bleaching Events (NESP TWQ 4.5, UQ)
Published on
05 November 2019
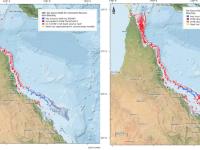
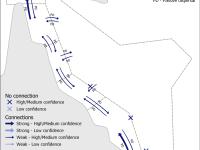
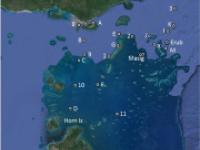
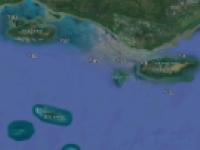
This dataset shows larval connectivities between reefs that exceeded, and did not exceed, thermal thresholds for damage during the 2016/2017 Great Barrier Reef bleaching events. The loss of reproductive adult colonies during bleaching events has the implication that coral cover recovery will require the supply of coral larvae from external sources (other reefs).